Bitcoin plummets below year’s floor – has the bubble burst?

Bitcoin, Daily and Weekly
Is bitcoin getting ready for in a roller-coaster ride?
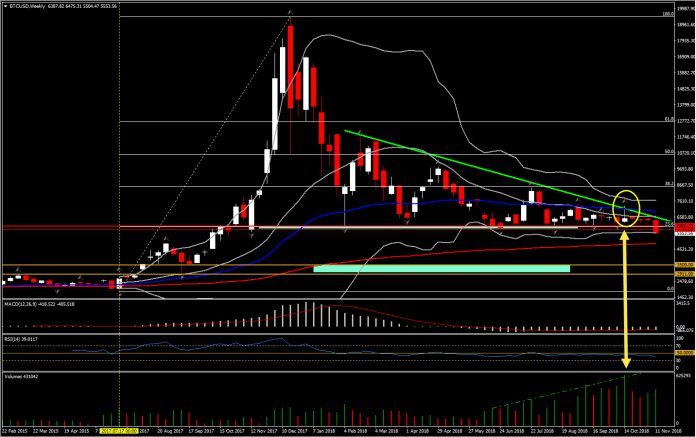
Last November, Bitcoin had a remarkable spike from $5,650.00 area up to $11,482.00,that would imply to the rise of the price 10-times more, within 6-months period. However the price reached a record high of $20,000 in the mid of December, before the reversal.
Since then, Bitcoin has been traded at the 30% of its peak value, with a continuously decreasing volatility, but keeping a constant floor for 2018 at around the $5783.00-$6,000.00 hurdle.
Compared to last year’s insane movement, the turmoil has gripped stocks, bonds, commodities and traditional currencies, leaving cryptos with low volatility. The current November represented so far, by a smooth and calm trading. Interestingly, the past 2 months Bitcoin has settled around $6,500, with a slow increase in the positive bias, something that has been interpret by many analysts as a chance of seeing repetition of last year’s rally.
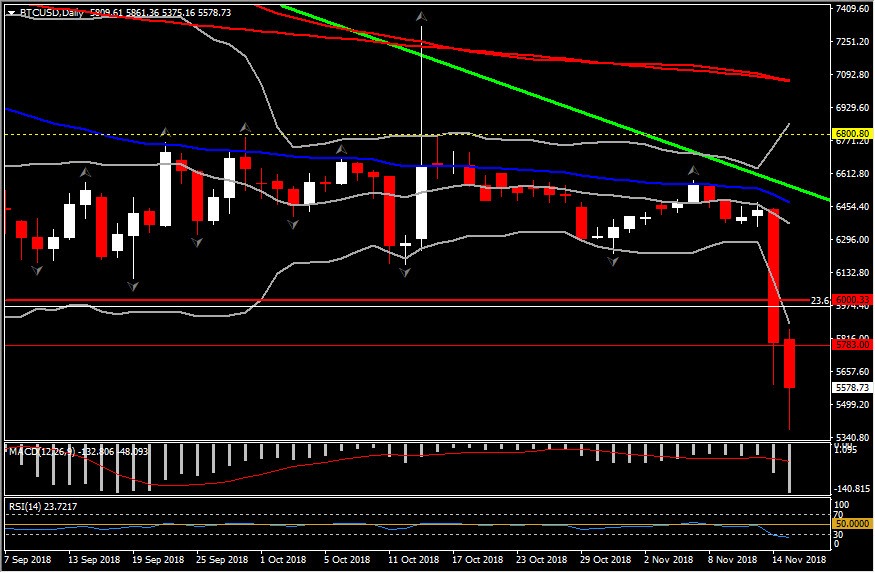
However today this scenario was proven wrong, as BTCUSD broke year’s low at $5,650.28and is currently traded around $5,550.00, after posting a low at $5,504.47. The enthusiasm for a potential upswing in cryptocurrencies has been muted on today’s performance, which seems to have a really high volume, even greater than the volume seen between November 2017 to February 2018.
Along with Pound, bitcoin seems to be today the 2nd biggest mover of the day. With just 2% movement in October, November ‘s movement but more precisely day’s move plummeted bitcoin’s price more than 13% which comes in line with US stocks today. Today, US equities lost some upside momentum in pre-market trade, despite the mostly friendly mix of US data (ex-Philly Fed, which sank). Fast-moving headlines on Brexit have hijacked some market attention and kept investors on edge after UK banks suffered on the UK cabinet rebellion and Parliamentary reaction. Stocks were mixed around the globe, with Sino-related indices 1.1-1.75% firmer after Beijing formally responded to US trade demands, while the Nikkei sank 0.2% in Asia.
The similar performance of US stocks and Bitcoin is quite rare within 2018, and more precisely in the 2nd half of the year. In October US stocks seen facing the biggest drop seen the past 7 years, in contrast with Bitcoin which faced a remarkable low volatility.
Hence, the focus turns on Bitcoin again, not exclusively on the break of year’s support but on the spike seen in volume as well. Interestingly, the largest volume spike was in the mid of October, which showed a lot of buying pressure (retest of $7,330 barrier), which overwhelmed by bears, which push the price $184 above the opening at $6,300. The volume was rising since June 2018 as price was falling. This indicates that sellers require decreasing numbers and increasing enthusiasm in order to keep pushing prices lower. Theoretically, a price drop on large volume is a stronger signal that something in the stock has fundamentally changed. Hence this could suggest that the price might fall further.
From the technical perspective, the asset moved below the descending triangle established in 2018, which consider be a bearish sign for the asset. Meanwhile, daily momentum indicators reached oversold area, suggesting that the bearish rally reached to an end. However weekly momentum indicators are bearish and point to more weakness in the near future. The weekly RSI is sloping negatively below neutral zone, whilst MACD confirmed a bearish cross with the signal line. These suggest the increase of bearish sentiment, with the next Support at $3,500-$2,911.00 (at 150-day SMA and October 2017 low). In the near term, Support is set at 200-week EMA, $4,867.90.
Oppositely, a rebound from this area along with the break of immediate Resistance between $6,000-$6,200, could drive the price towards the 20-week SMA of $6,625, while higher than that the 3-month Resistance at $6,800.
Author

Having completed her five-year-long studies in the UK, Andria Pichidi has been awarded a BSc in Mathematics and Physics from the University of Bath and a MSc degree in Mathematics, while she holds a postgraduate diploma (PGdip) in


