Bitcoin Makes Its Debut

US Dollar: Dec. USD is Down at 93.760.
Energies: Jan ’18 Crude is Up at 58.46.
Financials: The Mar 30 year bond is Up 2 ticks and trading at 153.03.
Indices: The Dec S&P 500 emini ES contract is 6 ticks Higher and trading at 2663.00.
Gold: The Feb gold contract is trading Down at 1245.70. Gold is 12 ticks Lower than its close.
Initial Conclusion
This is not a correlated market. The dollar is Down- and Crude is Up+ which is normal but the 30 year Bond is trading Higher. The Financials should always correlate with the US dollar such that if the dollar is lower then bonds should follow and vice-versa. The indices are Higher and Crude is trading Up+ which is not correlated. Gold is trading Down- which is correlated with the US dollar trading Up+. I tend to believe that Gold has an inverse relationship with the US Dollar as when the US Dollar is down, Gold tends to rise in value and vice-versa. Think of it as a seesaw, when one is up the other should be down. I point this out to you to make you aware that when we don’t have a correlated market, it means something is wrong. As traders you need to be aware of this and proceed with your eyes wide open.
At this hour all of Asia is trading Lower with the exception of the Aussie exchange which is fractionally Higher. As of this writing all of Europe is trading Lower with the exception of the London exchange which is Higher.
Possible Challenges To Traders Today
-
NFIB Small Business Index is out at 6 AM EST. This is major.
-
PPI m/m is out at 8:30 AM EST. This is major.
-
Core PPI m/m is out at 8:30 AM EST. This is major.
-
30-y Bond Auction starts at 1 PM EST. This is major.
-
Federal Budget Balance is out at 2 PM EST. This is major.
Treasuries
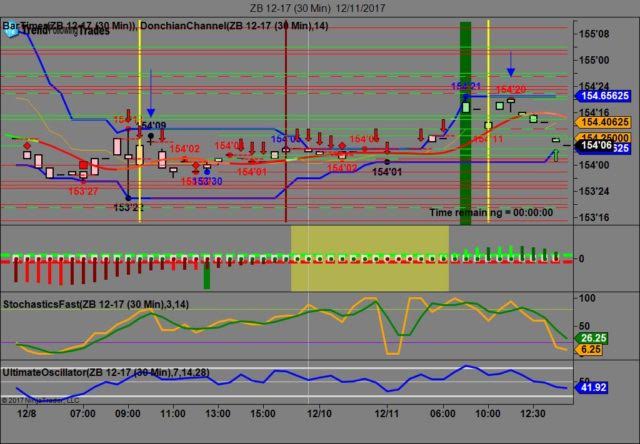
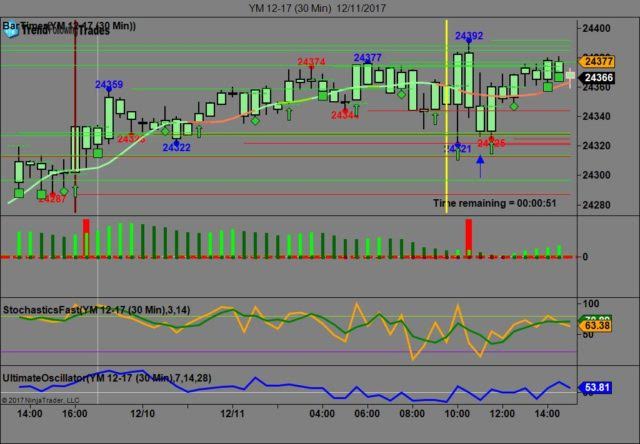
We’ve elected to switch gears a bit and show correlation between the 30 year bond (ZB) and The YM futures contract. The YM contract is the DJIA and the purpose is to show reverse correlation between the two instruments. Remember it’s liken to a seesaw, when up goes up the other should go down and vice versa.
Yesterday the ZB made it’s move at around 11 AM EST. The ZB hit a High at around that time and the YM hit a Low. If you look at the charts below ZB gave a signal at around 11 AM EST and the YM was moving Higher at the same time. Look at the charts below and you’ll see a pattern for both assets. ZB hit a High at around 11 AM and the YM hit a Low. These charts represent the newest version of Trend Following Trades and I’ve changed the timeframe to a 30 minute chart to display better. This represented a shorting opportunity on the 30 year bond, as a trader you could have netted about a dozen ticks per contract on this trade. Each tick is worth $31.25. We added a Donchian Channel to the charts to show the signals more clearly.
Charts Courtesy of Trend Following Trades built on a NinjaTrader platform.
Bias
Yesterday we gave the markets a Neutral bias as the Bonds and Gold were both pointed higher and in theory the indices should have been pointed lower and yet they were trading higher, hence the neutral bias. The Dow gained 57 points and the other indices gained ground as well. Today we aren’t dealing with a correlated market and will maintain a Neutral bias.
Could this change? Of Course. Remember anything can happen in a volatile market.
Commentary
Yesterday Bitcoins debuted on the futures market and some may herald this as needed, wanted etc. I always find interesting that every few years whenever the markets want to increase volume, they invent a new vehicle. Case in point years ago the markets invented Single Stock Futures which allowed tremendous leverage if someone wanted to own stocks with limited funds. The problem? No liquidity. Investing in Single Stock Futures is liken to roach motel, once you’re in it hard to get out. Bitcoins is not legal tender (although some argue that point). The reason is because it’s not being pegged against any other legal currency. The CBOE (Chicago Board of Options Exchange) announced that Sunday, December 19th was the first trading day for XBT; the futures contract symbol for Bitcoins. Time will tel how it all works out…
Author

Nick Mastrandrea
Market Tea Leaves


