Bitcoin is nothing if not a fantastic real-time test of some well-respected trading axioms around trendlines and Fibonacci support and resistance.
And it is this prism through which I view Bitcoin and on which basis I often say it charts very well.
And if asset charts very well then there is every likelihood the corollary will be that it trades equally well.
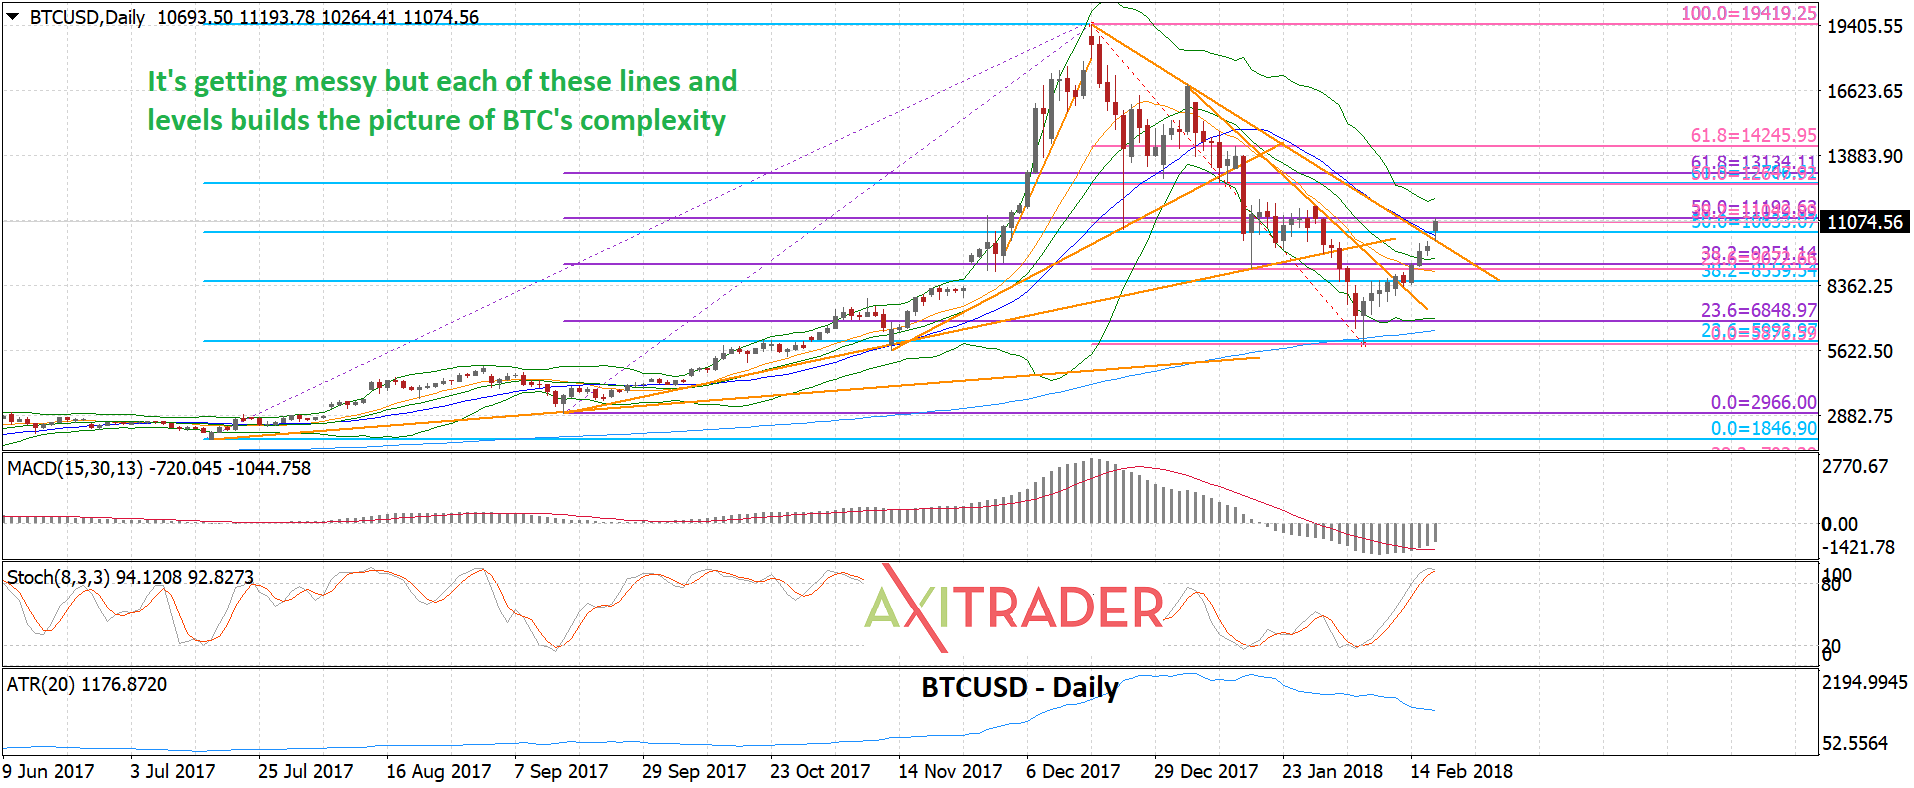
So it is today that when looking at the BTCUSD chart it's clear that after finding support exactly where it should have back in early February at a cluster of Fibonacci support and the 200-day moving average Bitcoin has since rallied, broken two trendlines and is now approach a significant cluster of Fibonacci resistance.
As you can see in the chart below this $10,600 to $11,200 holds three different Fibonacci levels including from the rally which began in mid-2017 to the record high, the rally from November to that record high, and more recently the fall from the record high to February's lows.
At $11,081 this morning BTC has already bested the lower level, broken the trendline from the high and is now approaching the 38.2% - garden variety - retracement level of the fall to February's lows. This zone also contains the 50% retracement level of November's rally which spiked to the record high.
So, a break of $11,200 could open up $1500 of clean air, with some resistance on the way to $12.700 around $11,700. It has to break topside first though and support is at $10,000/10,400.
Risk Warning: Trading Forex and Derivatives carries a high level of risk to your capital and you should only trade with money you can afford to lose. Trading Derivatives may not be suitable for all investors, so please ensure that you fully understand the risks involved, and seek independent advice if necessary. The FSG and PDS for these products is available from GO Markets Pty Ltd and should be considered before deciding to enter into any Derivative transactions. AFSL 254963. ABN 85 081 864 039.
Recommended Content
Editors’ Picks
EUR/USD stays near 1.0800 after upbeat US data
EUR/USD stays under modest bearish pressure and trades near 1.0800 in the American session on Thursday. The data from the US showed that the real GDP growth for the fourth quarter got revised higher to 3.4% from 3.2%, supporting the USD and weighing on the pair.
GBP/USD stays in daily range above 1.2600
GBP/USD fluctuates in a narrow channel above 1.2600 on Thursday. The better-than-expected Initial Jobless Claims data from the US and the upward revision to the Q4 GDP growth helps the USD stay resilient against its rivals and limits the pair's upside.
Gold pulls away from daily highs, holds above $2,200
Gold retreats from daily highs but holds comfortably above $2,200 in the American session on Thursday. The benchmark 10-year US Treasury bond yield stays above 4.2% after upbeat US data and makes it difficult for XAU/USD to preserve its bullish momentum.
XRP price falls to $0.60 support as Ripple ruling doesn’t help Coinbase lawsuit against SEC
XRP programmatic sales ruling by Judge Torres was completely rejected by another US Court that ruled in favor of the SEC in a lawsuit against Coinbase.
Portfolio rebalancing and reflation trades emerge into Q2
Yesterday’s price action pointed at a possible end-of-quarter portfolio rebalancing as the session saw the laggards of the quarter like Apple and Tesla gain, and the stars like Microsoft and Nvidia retreat.