Bitcoin and Litecoin Price prediction for today: BTC/USD key level at $10660, LTC/USD looking at $192,97
- Bitcoin trading in the lows' area of the current technical outlook.
- Key levels for BTC/USD: $8500 on the downside, $10660 on the upside.
- Litecoin has a vital support at $166.50, while key resistance is at $192.97.

European trading has started with BTC/USD moving around $9110 after the sudden movement on the way down that happened yesterday early in the American session. The technical outlook for today seems to propose tight ranges, as indicators are mostly bearish and have not much room to move without getting in trouble.
BTC/USD 1H chart
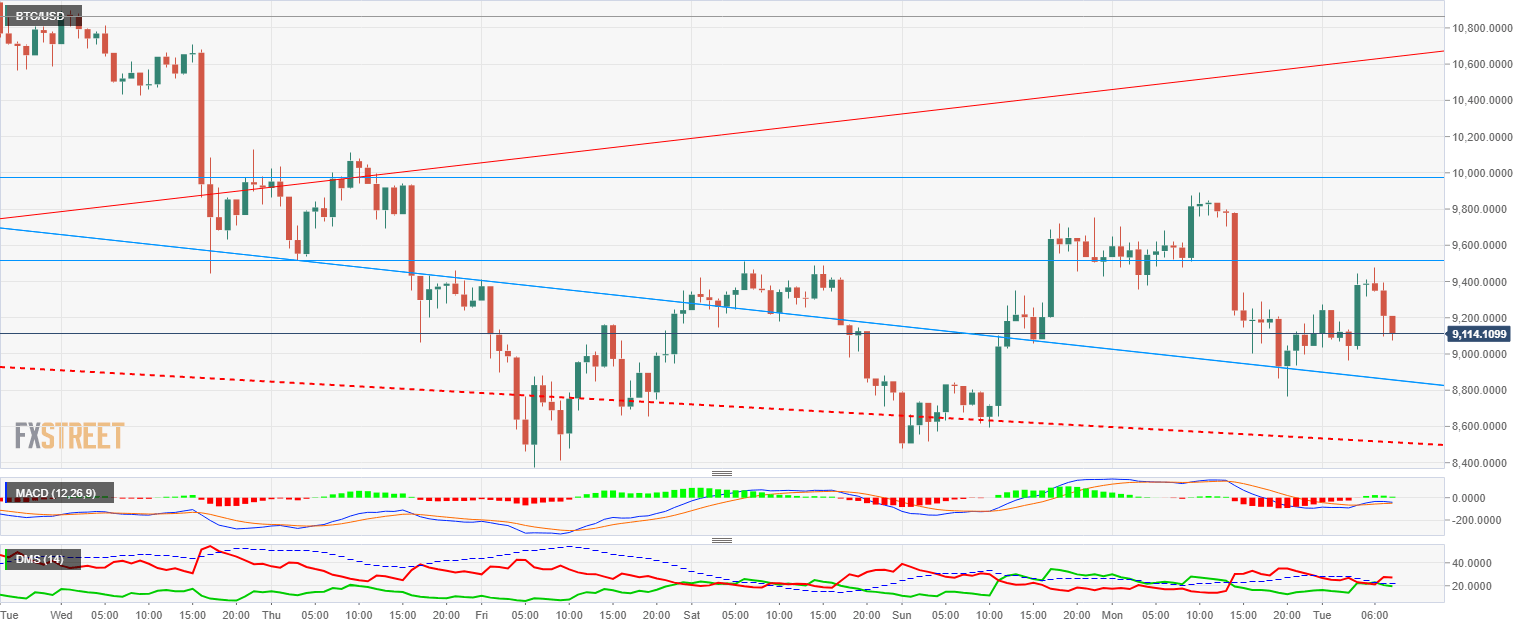
Bitcoin price is trading between the short-term trendline that rules the price action and the first support, a range between $8850 and a middle zone at $9510 that has acted both as support and resistance during the most recent trading sessions in the main Cryptocurrency. A possible long entry at a very-short term could be triggered in the aforementioned support, with a stop at $8760 and a quick target at $9520. The second target should be located at $9510.
For bearish entries, the signal in case the price breaks to the downside is located at $8760, with the target at $8500. Below that level, a possible increase in the speed of price and the primary target at $7500.
MACD in the Bitcoin 1-hour chart is trading below the equilibrium line, with a possible cross down. We observe a divergent behavior following the lows from last Friday that would support any bullish attempt.
Directional Movement Index shows a slight edge to the sellers, but with a setup very prone to swings in the bias. ADX is at 21.4, showing a very light bearish trend.
LTC/USD 1H chart
-636565333861697342.png)
Litecoin is trading inside a tight range between $166 and $192 since Friday afternoon. The LTC chart is not following the same pattern than the BTC one, with the LTC/USD lacking any kind of structural trend. We could set bearish positions up below the current support at $174.61, with stops above $176.80 and the target at $166.50. Above the $182 price area, there is a clear path to the next resistance, already signaled at $192. This would be a lengthy stop, as the guarantee level is far away, at $166. If you're looking for closer stops, we recommend looking at closer timeframes.
MACD in the 1-hour Litecoin chart shows how the price has a very horizontal profile. There are not divergences that support bullish openings.
Directional Movement Index shows a clear advantage of the sellers, with real possibilities that the D- might overcome the ADX, which would increase the control of the sellers. Buyers have increased in the last trading hours, probably due to the clarity in the bullish setups and the closeness of the stop. The ADX is right at the 24.7, a light trend level but with diminishing profile for the upcoming periods.
Author

Tomas Salles
FXStreet
Tomàs Sallés was born in Barcelona in 1972, he is a certified technical analyst after having completing specialized courses in Spain and Switzerland. He expanded his technical training following the guidance of great experts on the financial markets.


