Beyond CPI: The complete inflation story - July 2026

Each month, the Bureau of Labor Statistics releases the Consumer Price Index (CPI) report. Policymakers, pundits, and economists use this data to gauge the current inflation situation. For instance, the July CPI cooled a bit, raising hopes that the Fed will not raise interest rates next month.
However, the CPI only tells part of the inflation story. Relying solely on CPI is a little like looking at the temperature and claiming that you know the weather.
CPI tracks price inflation – more specifically, the change in the price of a basket of goods. But historically, inflation was defined as an increase in the supply of money and credit. Rising consumer prices are one of the impacts of this monetary inflation. In other words, the CPI measures a symptom of monetary inflation.
The CPI can tell us when past monetary inflation is showing up in the economy, but it can’t predict the trajectory of inflation. That means we need to look at money supply metrics to understand the complete inflation story.
With this in mind, when the CPI data comes out each month, I plan to produce a more comprehensive inflation report using four metrics – CPI, changes in the M2 money supply, changes in the Federal Reserve balance sheet, and the Chicago Fed National Financial Conditions Index.
July CPI data
Based on the headlines, you probably assume inflation is easing.
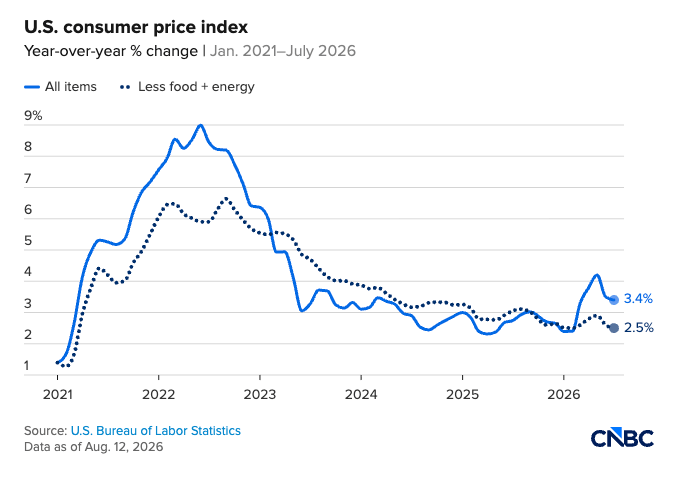
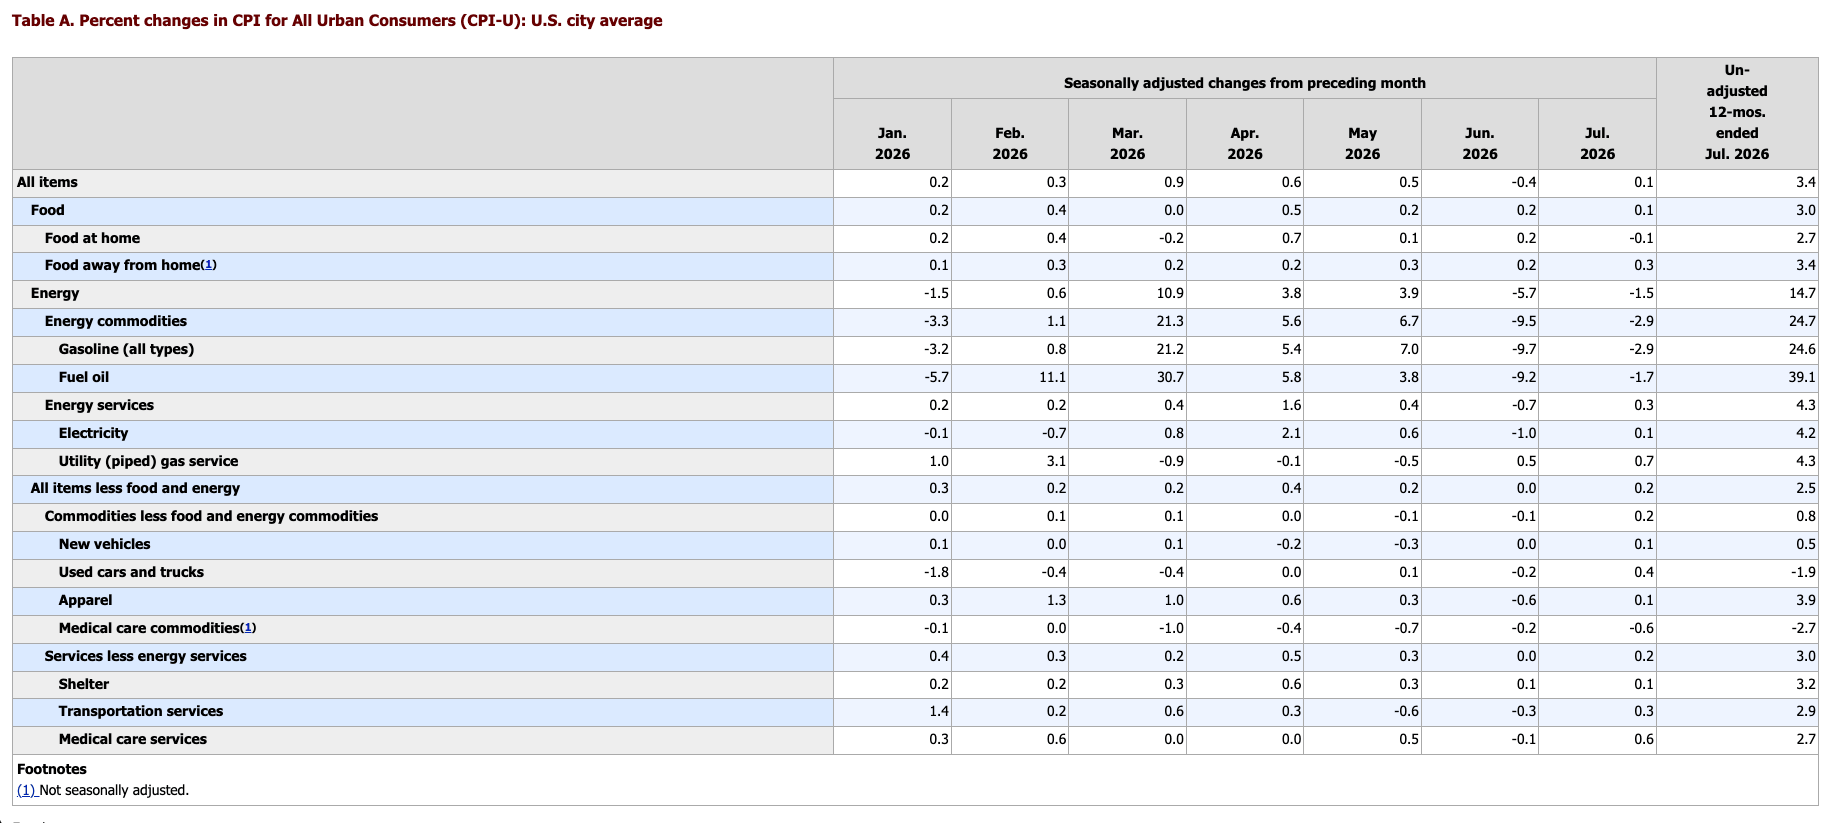
Prices rose just 0.1 percent month-on-month in July, according to the latest BLS data. That follows on the heels of a -0.4 percent decline in prices in June.
On an annual basis, the headline CPI fell from 3.5 to 3.4 percent.
Stripping out more volatile food and energy prices, core CPI ticked up by 0.2 percent, with the annual increase in prices dropping from 2.6 to 2.5 percent.
While still above the mythical 2 percent target, all these numbers fell within Wall Street forecasts, and they appear to be trending in a positive direction.
Another big drop in energy prices helped pull the overall CPI lower. The energy index dropped -1.5 percent month-on-month, driven by a healthy -2.9 percent dip in gasoline prices.
The medical care services index charted the steepest price increase in July, surging by 0.6 percent.
Increases in food, shelter, and service prices were modest.
With the sanguine price inflation data, traders lowered the odds of a September interest rate hike to 42 percent, according to the CME Group’s FedWatch gauge.
Morgan Stanley Wealth Management chief economic strategist Ellen Zentner told CNBC the CPI data “will keep the ‘no need to hike rates’ narrative that took hold after last week’s jobs report intact.”
“There will be another round of inflation data before the September FOMC meeting, so the storyline could still change. But unless those numbers tell a much different story, the Fed will likely still be in a position to leave rates unchanged next month.”
But when we look at the other inflation indicators, we find inflation isn’t nearly as tame as the CPI might indicate. In fact, it appears to be accelerating.
M2 money supply
While prices are cooling, the money supply is increasing rapidly. That is, by definition, inflation. However, we won’t see its impact on the general price level for months.
The money supply rose by nearly $100 billion, from $23.06 billion in May to $23.16 billion in June.
Since June 2025, the money supply has surged from $21.94 billion to 23.16 billion, a 5.6 percent increase.
In other words, we have an actual inflation rate of 5.6 percent.
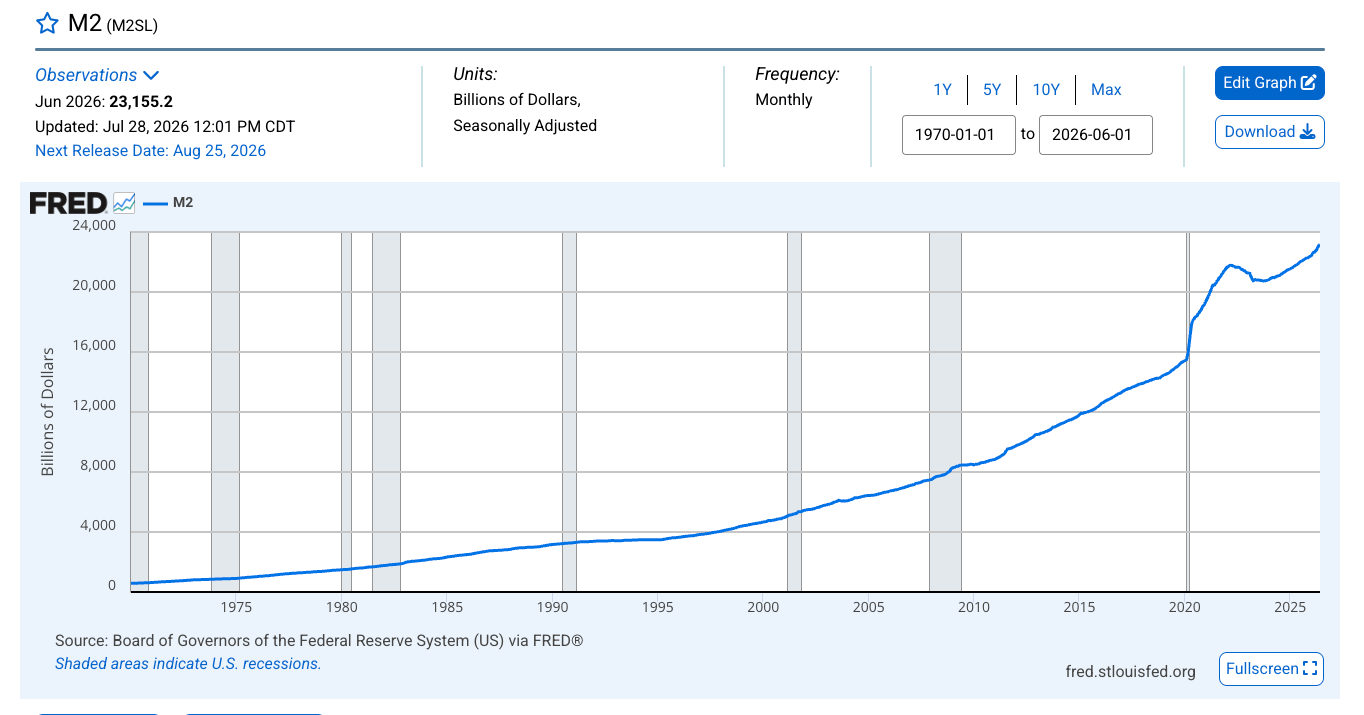
This monetary inflation will eventually find its way into consumer prices. (It could also manifest in rising asset prices such as real estate and equities.)
The Federal Reserve balance sheet
One reason the money supply is increasing is due to central bank money printing.
While Warsh & Co. talk tough on inflation, the Fed is running quantitative easing (QE) operations to create artificial demand for Treasuries and hold yields lower than they otherwise would be. That means the central bank is buying U.S. Treasuries and holding them on its balance sheet. To run this operation, the Fed creates money out of thin air to pay for these bonds, and it is injected into the economy. Again, this is, by definition, inflation.
The Fed will never admit to running QE. It will tell you it is just a technical operation to keep the financial system’s plumbing clear. But no matter what you call it, the practical impact is the same. The Fed’s balance sheet expands, and new money flows into the economy.
The central bank’s balance sheet began ticking higher in December, and the upward trend continues today. In the last month, the balance sheet increased from $6.72 trillion to $6.75 trillion.
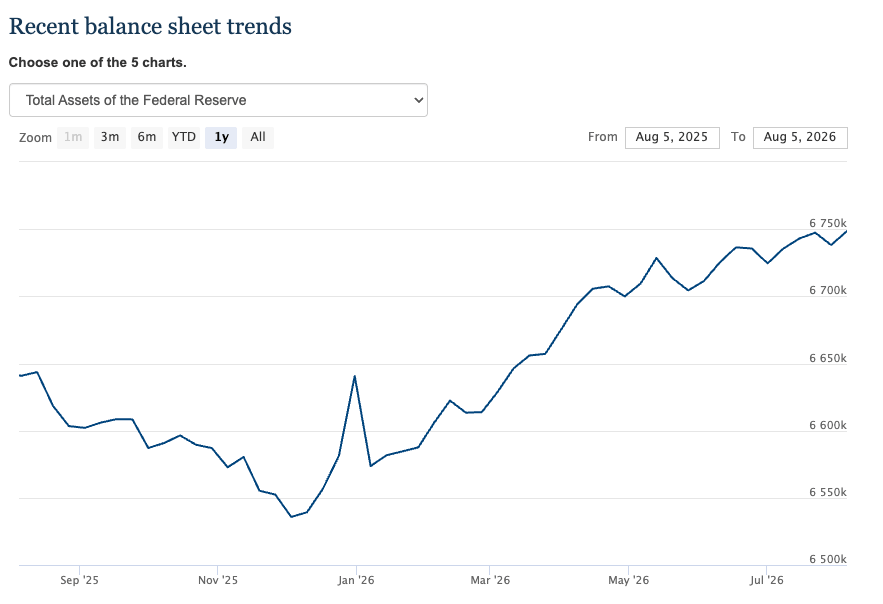
I can’t overstate the fact that the Fed is easing monetary policy through its balance sheet operations, even as it claims to be fighting inflation. Sure, the increase to the balance sheet is modest. But if you’re serious about an inflation fight, why isn’t the balance sheet shrinking?
The answer is that there is an evolving bear market in bonds. With yields rising and pushing up the federal government’s interest costs, the Fed has no choice but to step in and support the Treasury market.
National financial conditions index
While everybody imagines monetary policy is tight with the federal funds rate set between 3.5 and 3.75 percent, from a historical perspective, it is loose.
The Chicago Fed’s own National Financial Conditions Index (NFCI) reveals this.
As of the week ending August 7, the NFCI stood at -0.55. The minus sign indicates that financial conditions are historically loose.
Surprisingly, the NFCI never went positive, even during the height of the Fed’s tightening cycle. The highest it got was -0.09 in October 2022.
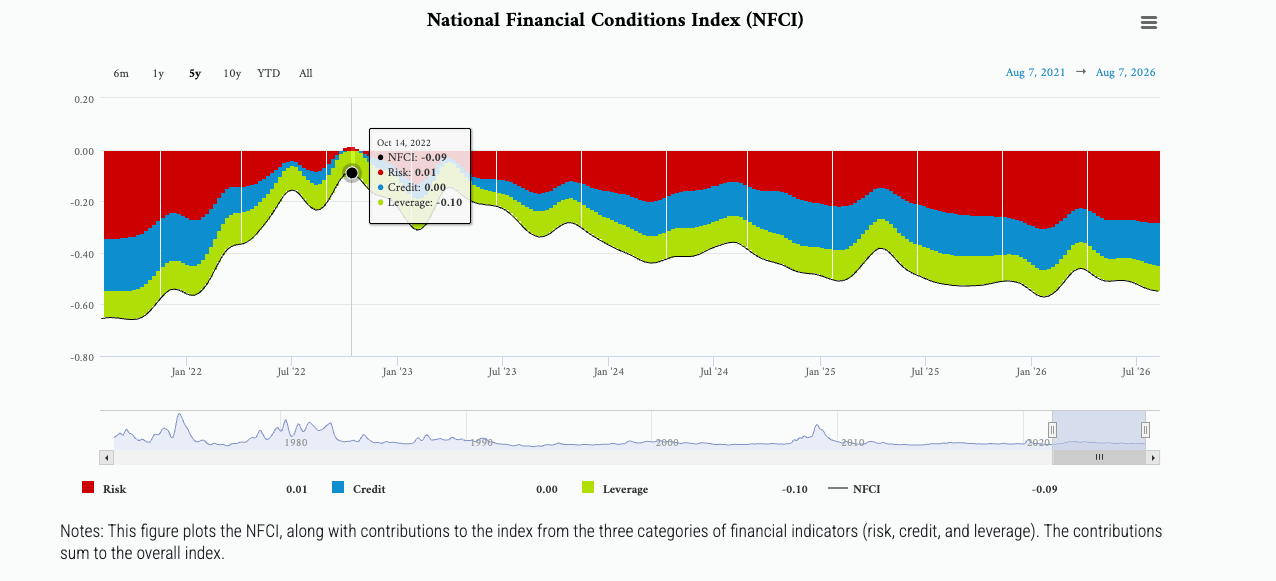
Again, this reveals that the Federal Reserve inflation fight wasn’t nearly as aggressive as advertised. It has maintained a historically loose monetary policy through the entirety of this inflation cycle.
It also reveals that the economy is addicted to easy money. The fact that the central bank could never get financial conditions tight for fear of collapsing the debt-riddled bubble economy is telling. It certainly wasn’t because inflation was under control.
Conclusion
When you put all the data together, the inflation picture looks much more concerning than the sketch you get with the CPI data alone. It’s clear that inflation is far from under control. It is on the upswing.
We’re getting some relief from rising prices, but given the increasing money supply, there is undoubtedly more price pressure in the pipeline. Whether it manifests in consumer prices, asset prices, or both, remains to be seen.
The bottom line is it’s not the time to celebrate inflation’s demise. Absolutely enjoy the lower fuel prices. But remember, there is more inflation in the pipeline. One thing you can count on: the powers-that-be will relentlessly devalue your money – at least by the planned 10-plus percent every five years.
To receive free commentary and analysis on the gold and silver markets, click here to be added to the Money Metals news service.
Author

Mike Maharrey
Money Metals Exchange
Mike Maharrey is a journalist and market analyst for MoneyMetals.com with over a decade of experience in precious metals. He holds a BS in accounting from the University of Kentucky and a BA in journalism from the University of South Florida.

















