Gold ignores the Dollar's new high: Strength or delay?

The USD Index broke out to 102.59 on Monday, its highest level since April 2025, above the 102.50 level that capped it on October 5, 7, and 8. Gold settled $25.70 lower at $4,190.60, and it trades near $4,210 this morning as the dollar and oil ease. That leaves gold about $50 above its October 7 settlement, while the dollar sits at a new high.
That gap is the question of the day: gold isn't at new lows while the dollar is at new highs, and the issue is whether that's real strength or delayed selling. Late September already answered that question once.
The Dollar broke out
Yesterday, I wrote: "As I wrote before – a breakout here can result in a quite significant rally – likely to 105 or so. This would – in turn – likely result in big declines in gold, silver, and mining stocks."
In fact, I’ve been warning against the rally in the USD Index for months. When the USD was below 97, very few listened.
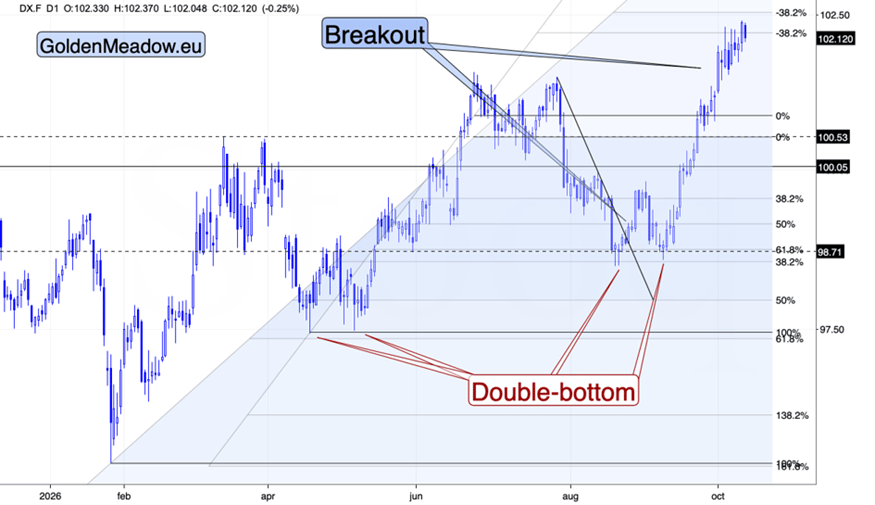
The breakout came on Monday. Oil drove much of it: Europe and Japan pay for imported oil in dollars, so higher oil means more euros and yen sold, and the euro and the yen make up 71 percent of the index. The euro fell to about $1.1158, and the Revolutionary Guard said it set a third supertanker on fire in two days. The index is near 102.35 this morning, easing as oil and yields pull back.
The breakout came on Monday. Oil drove much of it: Europe and Japan pay for imported oil in dollars, so higher oil means more euros and yen sold, and the euro and the yen make up 71 percent of the index. The euro fell to about $1.1158, and the Revolutionary Guard said it set a third supertanker on fire in two days. The index is near 102.35 this morning, easing as oil and yields pull back.
Why Gold isn't following the Dollar, yet
On Monday, gold reacted to the dollar the normal way: the dollar rose 0.37 percent, oil rose 2 percent, and gold fell 0.61 percent, more than the dollar rose. The divergence is in the bigger picture. Since October 7, the dollar has moved above its highs, and gold has stayed above its low.
There are three reasons for that.
First, the source of the dollar's strength: oil flows and a weak euro, not a new round of Fed repricing. December hike odds are near 85 percent, about where they were a week ago, and gold trades on the rate channel more than on currency flows.
Second, the Gulf: the war is now hitting Saudi airports and tankers, and gold-backed ETF inflows have reached a four-year high, according to Bloomberg data.
Third, gold price is in the rebound that usually follows a completed head-and-shoulders pattern.
On the surface, gold holding above its low while the dollar makes new highs looks like the bottoming sign I described on October 6. The record says otherwise, because we saw the same divergence in late September.
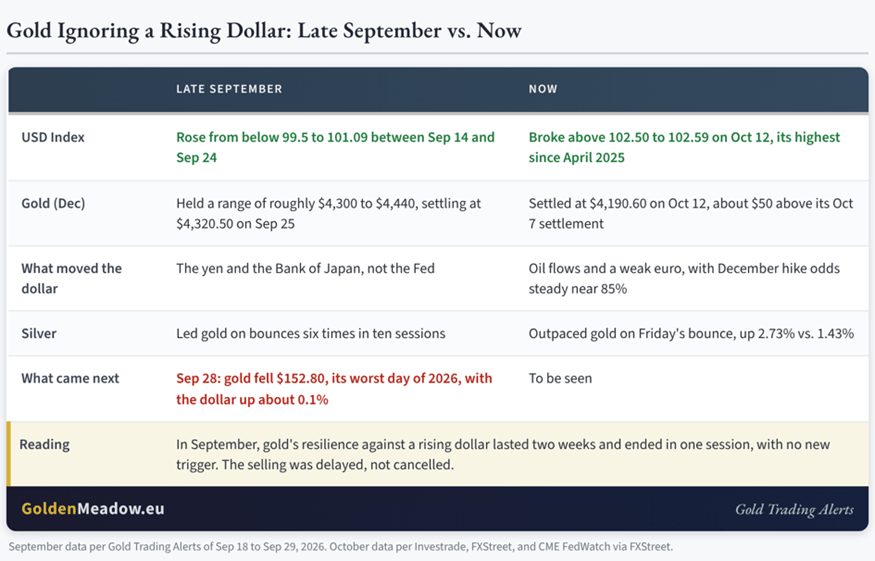
Between September 14 and September 24, the USD Index rose from below 99.5 to 101.09, and gold held a range between roughly $4,300 and $4,440. On September 18, the two even rose together, because the yen moved the dollar and the Fed didn't. Then, on September 28, gold fell $152.80 in one session, its worst day of 2026, with the dollar up about 0.1 percent. That morning, I wrote: "this is the completed pattern selling, not a dollar move."
The selling the dollar's rise implied wasn't missing in September. It was pent up, and it came out all at once, without a trigger. That's the reading I think applies now. Gold's reaction to the dollar's breakout is likely delayed, not cancelled.
What would change that reading is confirmation from silver and the miners, and it isn't there. Silver price outpaced gold on Friday's bounce, the same behavior it showed six times in ten sessions before the September slide, and the miners gave back Friday's gains about three times as fast as gold on Monday morning.
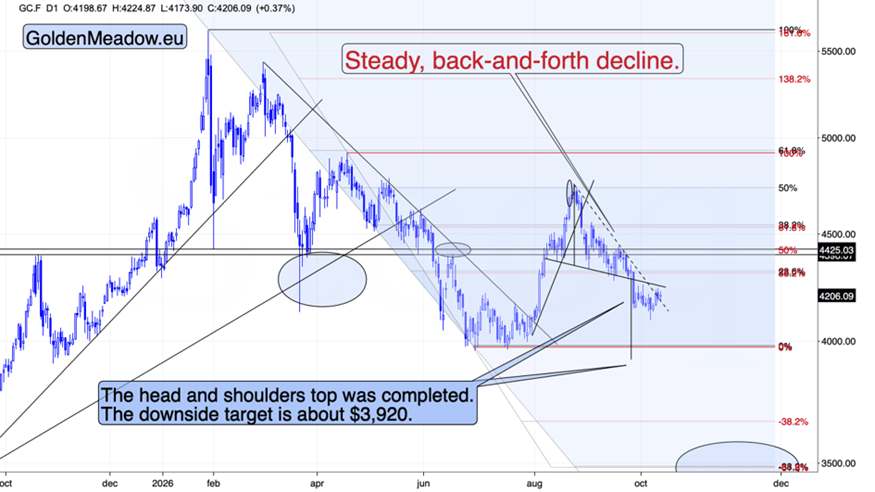
Gold remains below the highs of its verification rebound, $4,251 on September 30 and about $4,239 on October 2.
Why strong ETF inflows don't contradict the bearish outlook
Gold-backed ETF inflows have reached a four-year high, according to Bloomberg data, and it's fair to ask how that fits with a bearish outlook. It fits, for three reasons.
First, ETF flows follow the price and the headlines rather than lead them. ETF investors are free to sell as quickly as they bought, which makes them different from central banks, which buy and hold. A war escalation brings in hedgers, and the hedgers leave when the headlines fade or the losses mount.
Second, today's buyers are tomorrow's sellers. Every ounce that flows into an ETF on a war headline is an ounce that might flow back out later. Strong inflows during a decline add to the supply that comes back to the market when the decline resumes. The inflows also haven't stopped the price from falling: gold made its lowest close since early August on October 7.
Third, the 2012 to 2013 analogy I've been following points the same way. Gold topped in September 2011, yet global gold ETF holdings kept rising and reached a record 2,632 tonnes in December 2012, during the last corrective rally of that decline. In 2013, ETFs saw net redemptions of about 800 tonnes, and that selling fed the slide that took gold from about $1,800 to about $1,200. The record holdings came more than a year after the price top, at the end of the corrective upswing, not at the start of a new bull market.
ETF inflows explain part of gold's resilience against the dollar. They don't change where that resilience is likely to end.
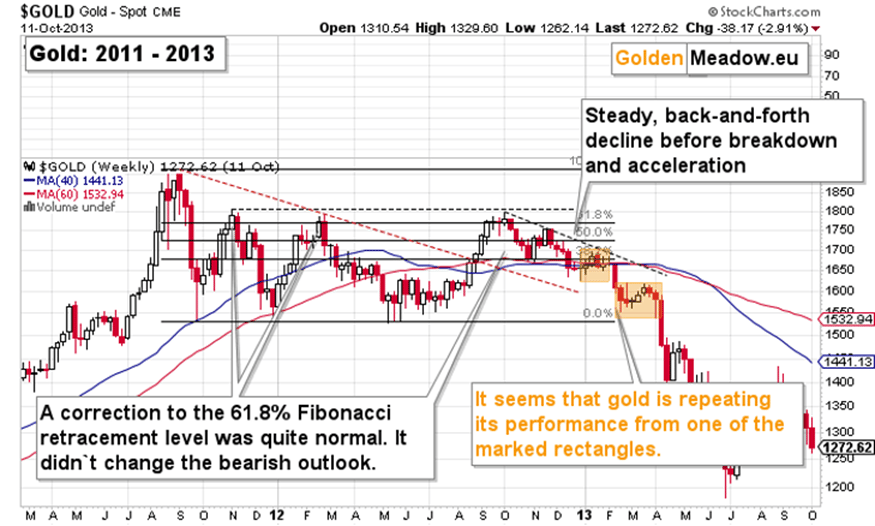
In 2012, the biggest wave of ETF buying came at the end of the rebound, which makes the 2012-2013 – now analogy even stronger. Plus, the people who bought it in 2012 became the sellers of 2013.
Where this leaves us
The USD Index broke out to its highest level since April 2025, oil rose for a second day, and gold fell more than the dollar rose on Monday while staying above its October 7 low. The divergence between gold and the dollar is real, and it's the same one that preceded the September slide. Silver and the miners aren't confirming any strength in gold.
In September, gold's patience with a rising dollar lasted two weeks. It ended in one session.
Want free follow-ups to the above article and details not available to 99%+ investors? Sign up to our free newsletter today!
Author

Przemyslaw Radomski, CFA
Gold Price Forecast
Przemyslaw Radomski, CFA (PR) is a precious metals investor and analyst who takes advantage of the emotionality on the markets, and invites you to do the same. His company, Sunshine Profits, publishes analytical software that any

















