EUR/USD: Trading with the wave count and banking +54 pips (+2%)

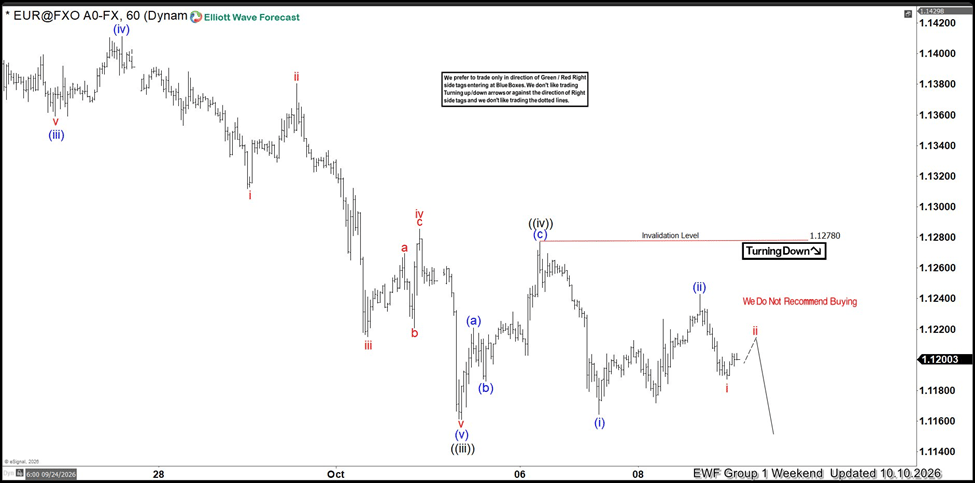
October 10 2026, before the open of the trading week, we advised EWF members that the EURUSD pair was in a bearish wave count and that a move lower was coming.
EUR/USD one-hour chart weekend update October 10 2026 (Bearish wave count)
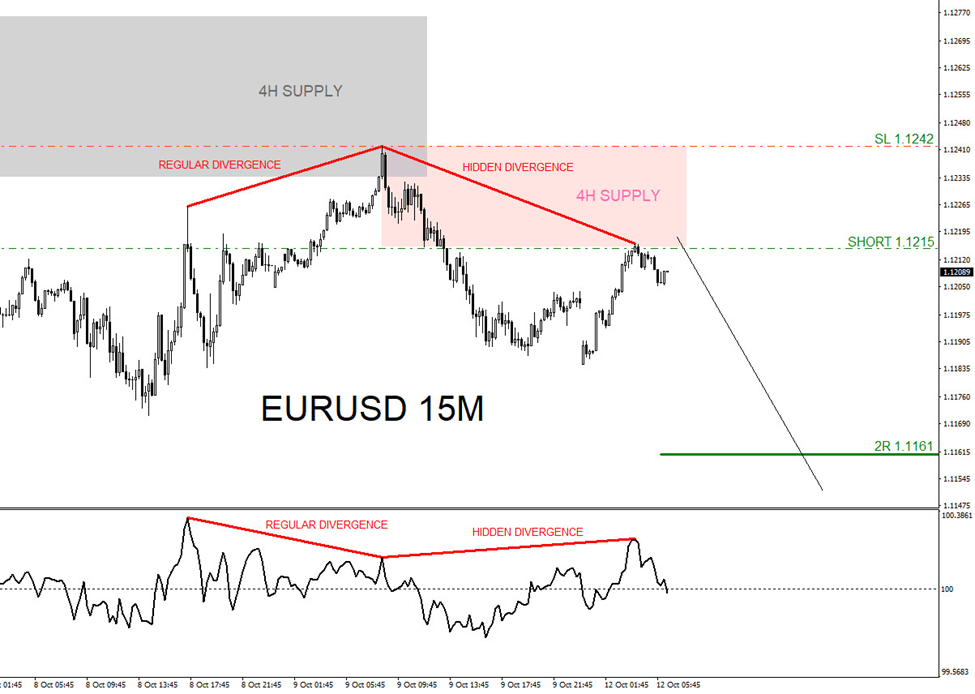
On October 11 2026 I entered the SELL trade when EURUSD tapped the 4 Hour supply zone (Pink). Visible bearish signals, before the sell entry, was the bearish regular divergence pattern (Sign of trend reversal) which reversed lower from the 4 Hour supply zone (Grey) and the hidden divergence pattern (Sign of trend continuation). Together with the bearish wave count I entered the sell entry with confidence.
EUR/USD 15 minute chart October 11 2026 (Entry)
EUR/USD 15 minute chart October 12 2026 (Target HIT)
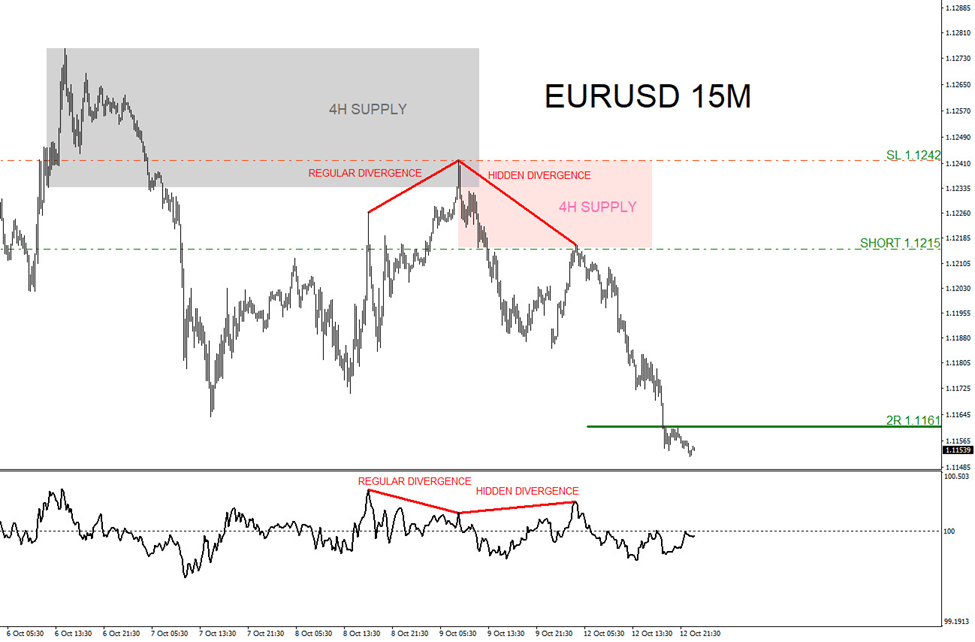
EURUSD moves lower and on October 12 2026 price hits the 2R target at 1.1161 from 1.1215 and I closed the sell trade for +54 pips (+2% gain risking 1% on every trade).
Author

Elliott Wave Forecast Team
ElliottWave-Forecast.com

















