Bell opening – Wall Street update, cautious moves amid Macro and Astro shifts

Global markets are navigating mixed signals as investors hedge China policy risks and reassess tech momentum amid rising yields. All eyes are now on key catalysts this week, including FOMC minutes, Nvidia earnings, and inflation data.
Global risk mood – Mixed signals
- China Tariff Hedge: Smart money rotating into undervalued Chinese ADRs—tech, green energy, and semiconductors—amid policy risk.
- Relief Rally Weakening: Higher bond yields (10Y UST > 4.55%) and mixed tech performance (despite Nvidia strength) mark a shift toward caution.
Upcoming catalysts

Gann, musical and Astro interpretation for E-mini
Harmonic astro-vibration levels are shaping pivotal market zones. Based on Gann and musical frequency synthesis:
- Moon = C = 5760 Hz → Emotional Support Base → Market repeatedly respecting 5760 as a magnetic support node, aligned with 26° Pisces and Zero Aries Gann levels.(5756)
- Sun = F = 5873 Hz → Clarity & Ignition Level needs to break Soon ( Mars Moon conjunction- Aspect time line) → A level triggering directional confirmation — used as launch pad in recent rallies.
- Mars = G = 5940 Hz → Breakout Decision Zone / War Energy → Market pausing just under 5940; clearing this level activates breakout toward 6065+.
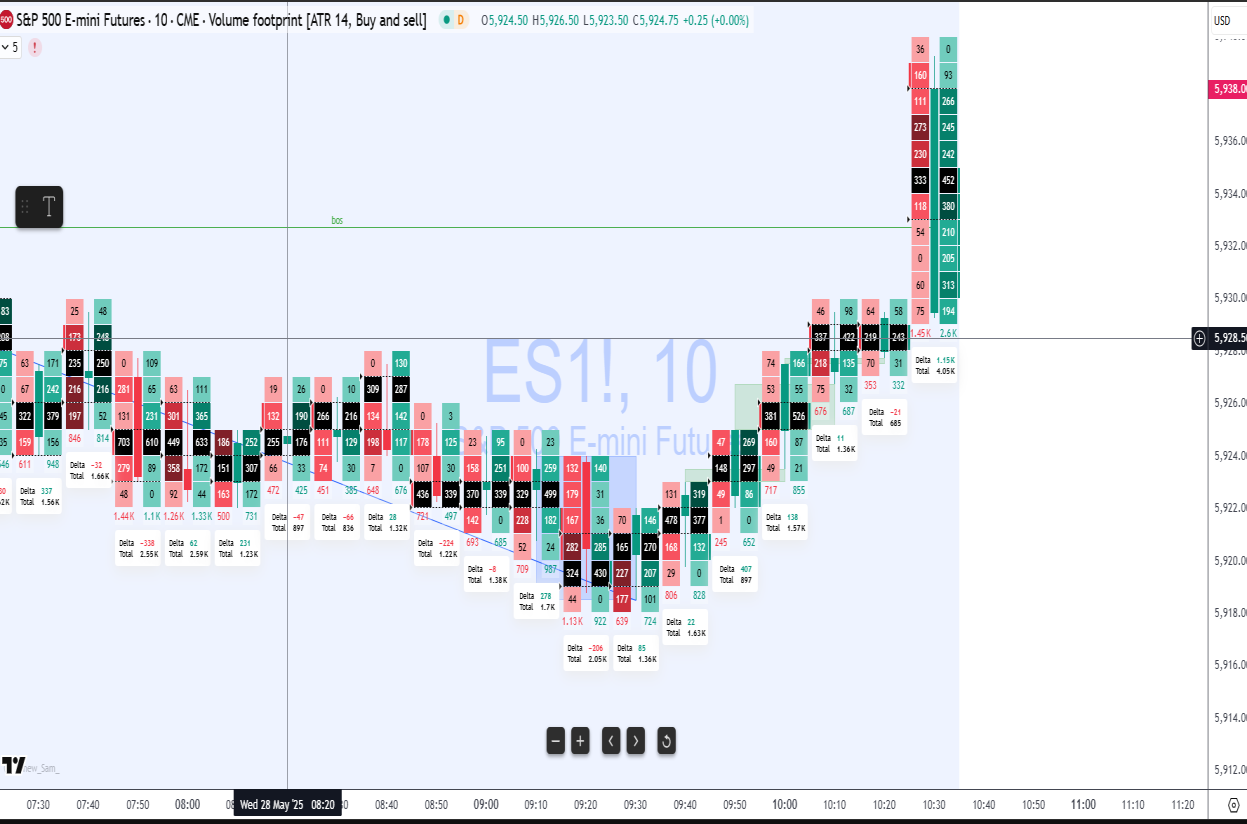
ES mini futures (S&P500)
- Current Price Zone: Testing 5939–5941
- Structure: B-wave possibly unfolding; invalidated above 5941
- Support: 5756–5760
- Breakout Target (Wave C): 6065 if 5941 decisively clears
- Short Active: 5912–5923
- Stop: 5960( now See how it unfolds at Fomc minutes then build position again)
- Target: 5730 → 5670
Trade Table:

Mars (5940 Hz) is your activation gate — breakout or reversal decision.
Euro FX futures (6E) – Wave 4 evolving
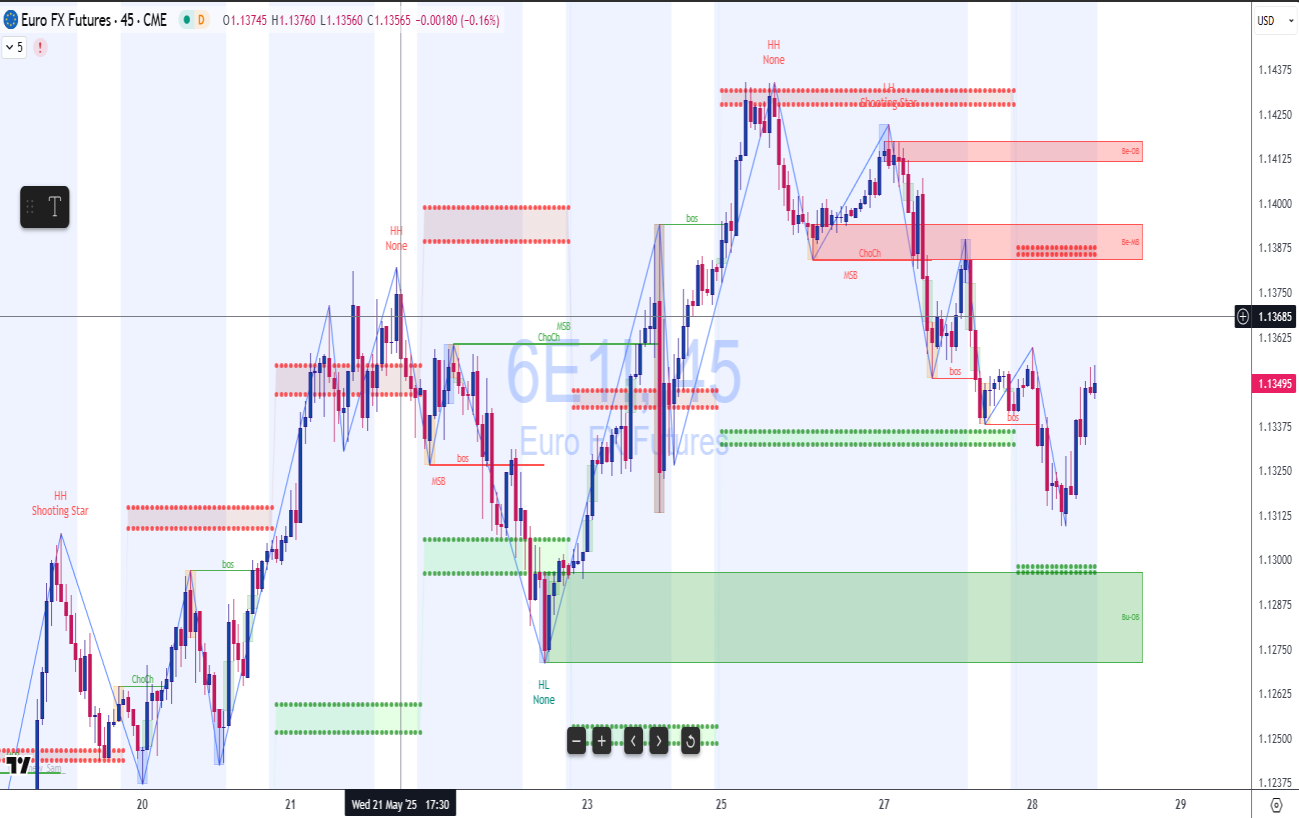
Wave Count – Wave (5) in progress, Wave 4 near completion
Intraday High/Low (Estimated)
- High: 1.1372.
- Low: 1.1250.
Expected Pullback: Shallow dip possible just shy of 1.1235 target
Holding Short: From 1.1430
Low Forming: Around 1.1170 area
Strategy

Adjustments may follow as price behavior near key cycle lines later in the session.
Gold (XAU/USD) – Layered plan, short first, buy lower
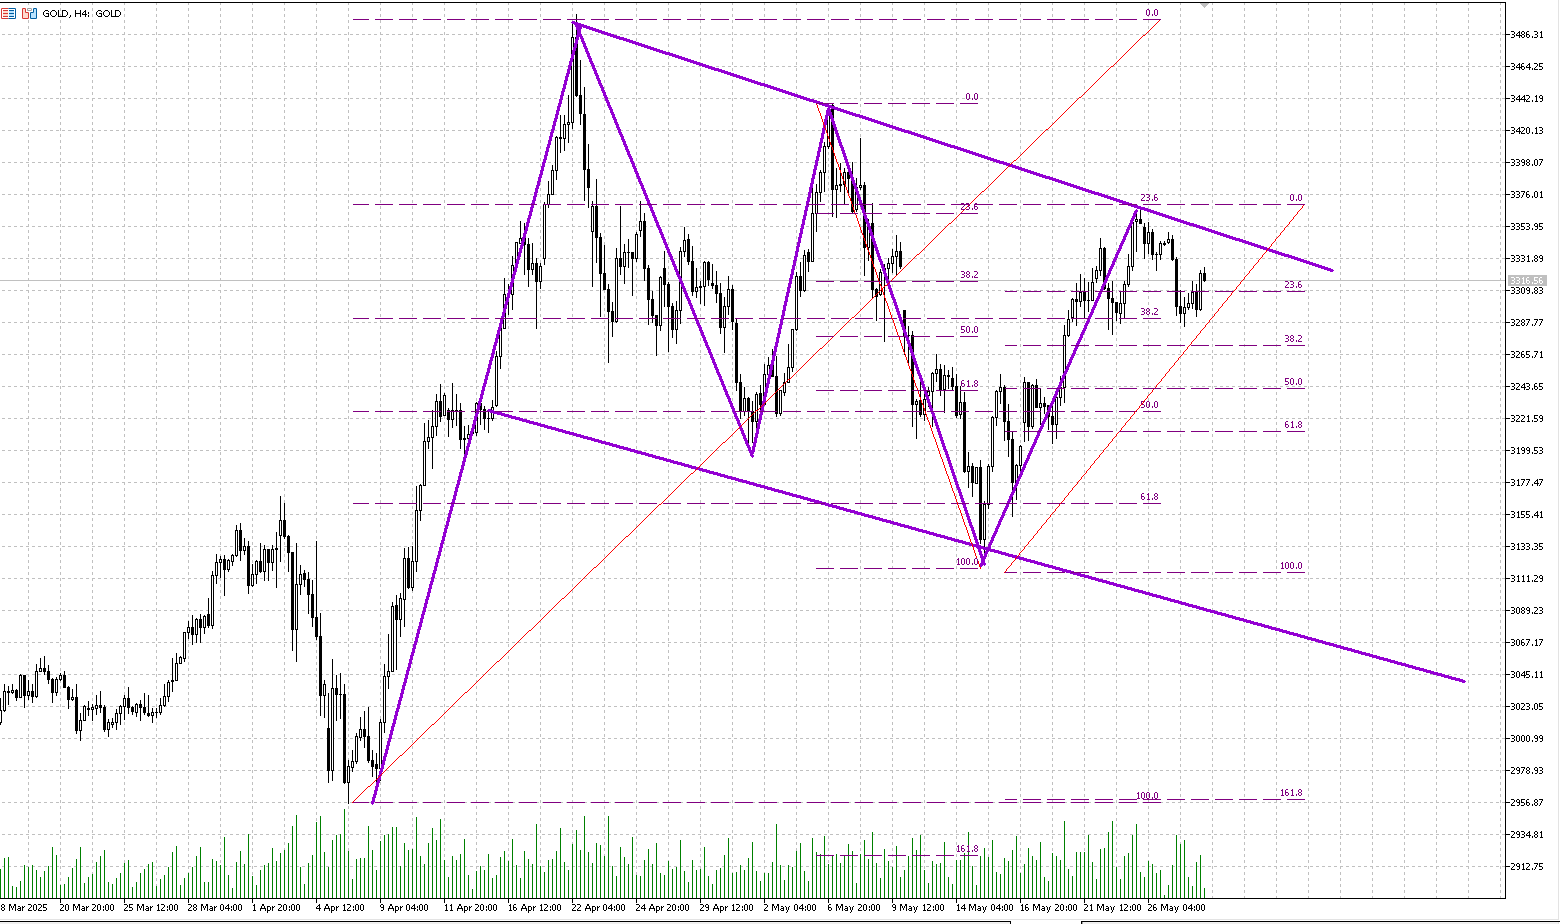
- Short Zone: 3326–3336.
- Target for Cover: Around 3302.
- Break Risk Level: Below 3265.
- Buy Plan: If it dips to 3272–3276 zone → Buy.
o Stop Loss: Below 3257.
o If stop holds → Add on confirmation.
Strategy

Crude Oil – Waiting for dip near moon level
- Current Bias: Buy near 5905.
- Short Cover: Existing shorts moved stop to breakeven.
- Structure: Potential for final corrective leg before breakout.
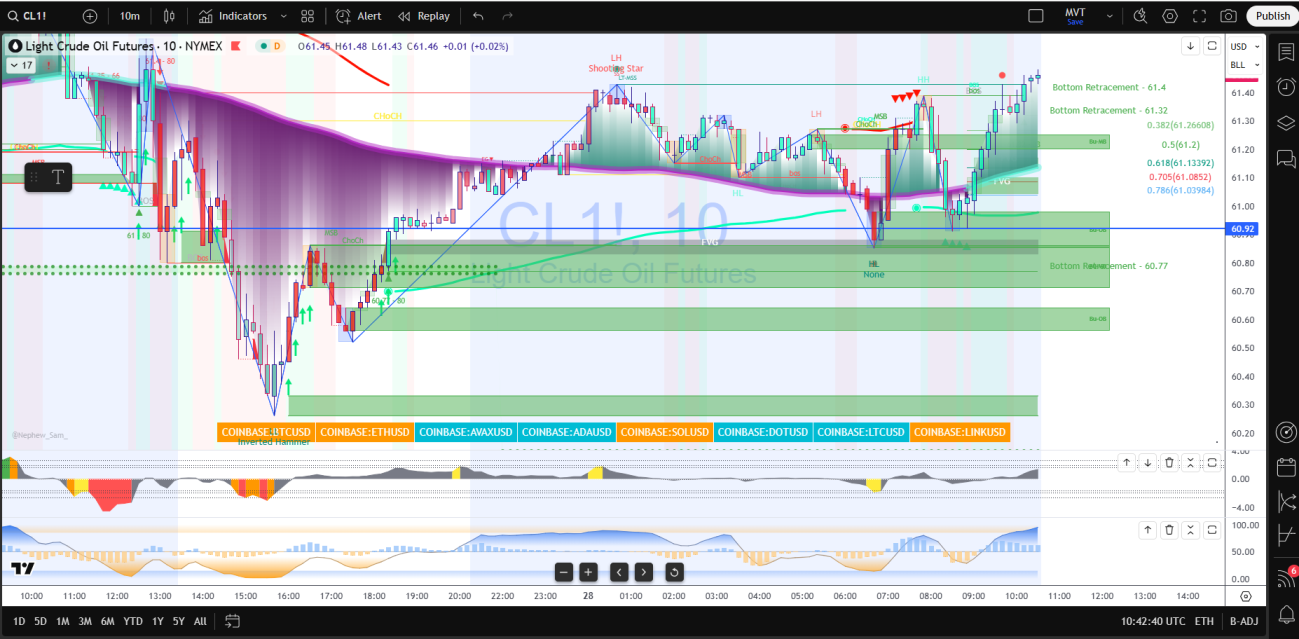
Market Context
- Current Price: $61.46.
Structure and Price Action
Change of Character (CHoCH)
- A bullish CHoCH was confirmed at $60.75 after the market shifted away from the prior downtrend and formed a higher low.
Break of Structure (BOS)
- A bullish BOS was confirmed above $61.20, validating continuation in bullish direction.
- A second BOS is now seen above $61.45, supporting ongoing upside development.
Order Blocks (OBs)
Major Bullish Order Block (Demand Zone):
- Located between $60.30 and $60.75
- Price reacted sharply from this zone, creating a new bullish leg and serving as a strong reference for future retracement entries.
Minor Bullish Order Block
- Identified between $61.20 and $61.35
- This zone may now act as a support region if price retests, with bullish continuation expected above it.
Fair value gaps (FVG)
Filled FVG
- The gap between $60.80 and $61.20 was previously filled and confirmed as a zone of efficient price delivery.
New FVG in development:
- Emerging above $61.45. If price creates an imbalance and retraces into it, it can serve as a long entry opportunity aligned with current bullish order flow.
Fibonacci levels and confluence
- 0.618 Retracement: $61.38.
- 0.786 Retracement: $61.08.
Projection targets

Risk Management
- Stop loss has been adjusted to break-even at $61.72 after the BOS at $61.45.
- Any CHoCH or BOS below $61.20 would negate the current bullish bias and warrant reevaluation.
Pattern Notes
- Higher high and higher low structure is intact.
- A shooting star candle around $61.50 was absorbed without reversal, indicating buyer strength.
- MACD and momentum indicators at the bottom of the chart suggest rising momentum.
Strategy
The current structure is bullish. As long as price remains above the $61.20 OB and maintains HL structure, the trend favors higher levels. Watch for potential retracement entries near $61.35 and continuation toward $62.20 and beyond.
Key invalidation is a breakdown below $61.20, which would signal a shift back to bearish structure.
Silver (XAG/USD) – Descending triangle in play
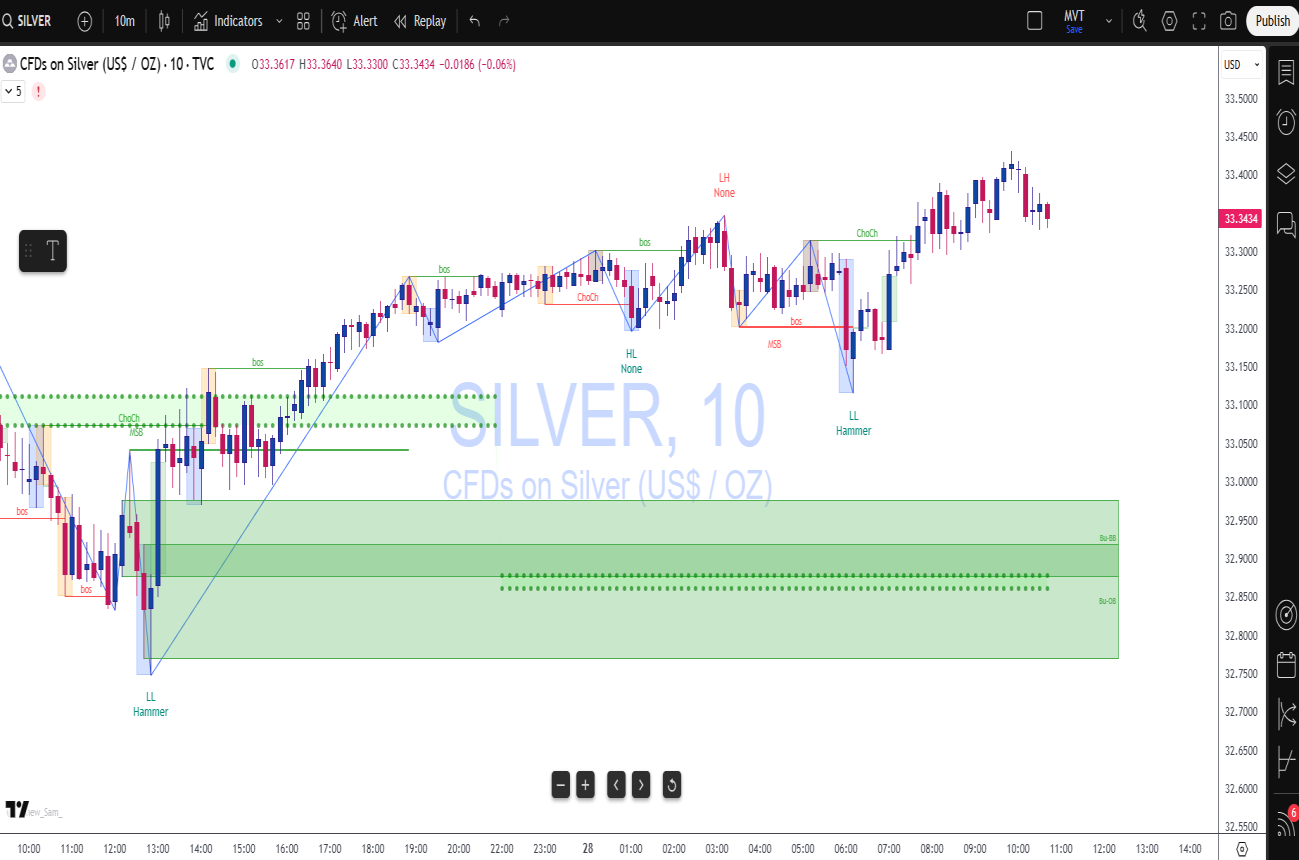
Bias Overview
- Short-Term Bias: Bearish as long as price remains below $33.47.
- The current structure favors lower prices unless we see a sustained move back above this level with a structural break.
Key Breakdown Levels
- A decisive break below $32.78 is critical. This would indicate a clear bearish BOS and open the path toward:
o First target: $32.35.
o Extended target zone: $32.05.
Order Block (OB) Demand Zone to Watch
- A strong bullish order block sits between $32.05 – $31.88.
o This is a historically respected demand zone where algorithmic buying and smart money participation is likely to occur.
o Expecting aggressive buy-side reaction if price reaches this zone.
ICT-Style Setup Expectation
- A liquidity raid or sell-side sweep below $32.08 could trigger a fast reversal.
- If price dips into the $32.05–$31.88 zone, monitor for bullish CHoCH and OB confirmation.
- Look for displacement candles and fair value gap formations as entry cues.
Strategy

Price action
- Price currently hovering near key breakdown level of $32.75.
- A sweep below may attract liquidity and induce either a continuation dump toward the OB or trap sellers for a fast reversal.
- Momentum buyers already triggered above $33.55, but if failed, a reversal back into the OB becomes probable.
Scenarios to Monitor
- Bearish Continuation:
o If price closes below $32.75 on higher volume and no bullish reaction, expect downside to deepen toward $32.05–31.88 OB zone.
- Bullish Reversal Setup:
o If price sweeps the $32.08–$31.88 range and forms a bullish CHoCH with FVG above, then watch for long entries toward $33.18–$34.00.
Markets remain tactically driven with technical and astro-cycle cues shaping short-term plays. Patience and precision will be key as setups unfold across metals, energy, and FX.
Author

Faysal Amin
Mind Vision Traders
Faysal Amin is a seasoned financial analyst and market strategist with over a decade of experience in global markets, including equities, forex, and commodities.


