Bell opening – Technical forecast for E-mini, Euro and Crude Oil

Macro overview
The United States has delayed tariffs on European imports until July 2025. This development has temporarily lifted market sentiment, leading to a short term rally in risk assets. However, Moody's potential downgrade of the U.S. credit rating continues to weigh on broader market stability.
A JPMorgan survey indicates a growing preference among global investors for European equities over U.S. stocks, citing concerns about high valuations and policy uncertainties.
Crude oil rallied in response to the tariff delay, signaling speculative support and short covering in energy markets.
Macro event watchlist
|
Date |
Event |
|---|---|
|
May 27 |
U.S. Consumer Confidence |
|
May 30 |
Eurozone CPI Flash Estimate |
|
June 3 |
OPEC+ Meeting |
|
June 5 |
U.S. Services PMI |
|
July 1-5 |
U.S. Europe Tariff Implementation Window |
S&P 500 Index futures (June 2025 contract four-hour chart)
Elliott Wave structure
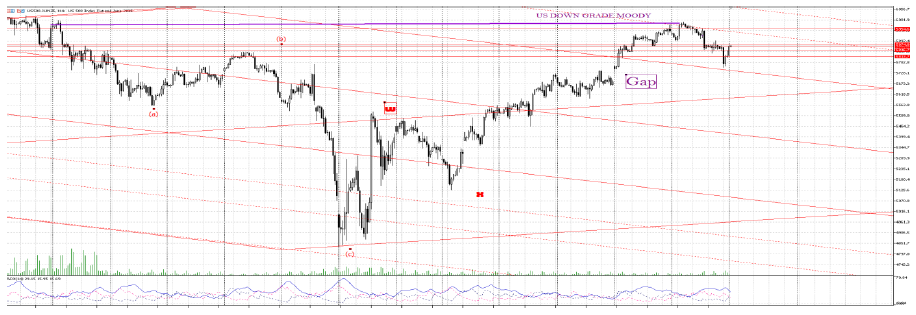
The index appears to have completed a complex W X Y corrective pattern off the all-time highs, with a rejection from the 6009-6010 area. Current price action suggests the beginning of a new impulsive decline, potentially forming Wave A or Wave 1 to the downside.
Key technical levels
Resistance
- 5922: Minor resistance and midpoint of recent order block.
- 6009 6010: Key supply zone from recent rejection.
Support
- 5782: Immediate support; reaction zone aligned with median of pitchfork.
- 5670 5618: Major support zone and target for broader correction.
Hourly chart and break of Wave count
Market structure and bias
Price rejected from the top of the descending channel, signaling renewed Price rejected from the top of the descending channel, signaling renewed downside pressure.downside pressure.
The mid fork support at 5670 remains an important level if the price fails to reclaim 5922. Based on the hourly wave count, the 5th wave completed at 5992. From there, the decline started with Wave 1 at 5905, Wave 2 moved up to 5956, Wave 3 dropped to 5827, Wave 4 retraced to 5896, and Wave 5 went down to 5756, marking the completion of the wave structure. Currently, a corrective Wave B is in progress, which may reach the 5922 area. If that happens, a larger Wave C could follow, pushing the price down toward 5597. However, a break above 5943 would invalidate this entire wave structure.
Bearish momentum remains intact below 5922; price must break above 6009 to shift the outlook to neutral or bullish.
Trading outlook
|
Direction |
Entry |
Stop |
Target |
|---|---|---|---|
|
Short |
5915-5922 |
5960 |
5730-5670 |
|
Long |
Break above 6009 |
5960 |
6100-6150 |
Euro FX futures (6E –– Four-hour chart)
Wave count
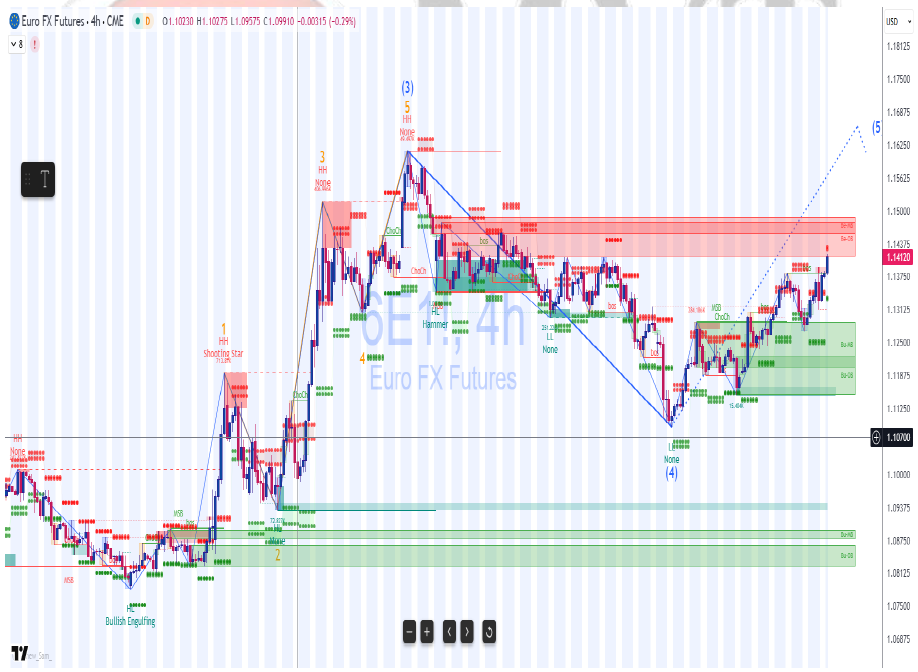
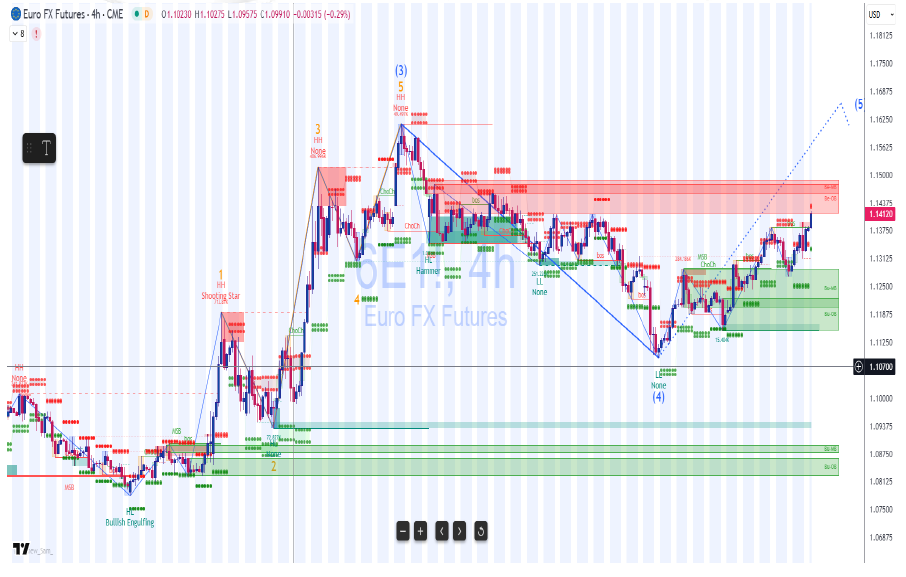
Euro remains in Near-term of the broader impulse structure that began from the 1.1070 base. The pair is testing a key supply zone near 1.1430-1.1480.
Price structure
- Bullish momentum persists with higher highs and higher lows.
- Market Structure Break (MSB) and Change of Character (ChoCh) confirmed on lower timeframes.
- Near-term resistance may cause a pullback before the next leg higher.
Wave count and structure
- The Elliott structure shows we are currently in Wave (5) up of a broader 5-wave impulse.
- Wave (4) ended at 1.1070, forming a solid support base with a 15.40K OB Buy-Side Order Block.
- Current price is 1.1412, testing a high concentration supply zone (Be OB & Be MB) around 1.1430-1.1480.
Key structures
- Multiple Change of Character (ChoCh) and Market Structure Breaks ( occurred between 1.1200 and 1.1350 confirming the bullish shift.
- Resistance zone: 1.14 80-1.1 535.
- Support zone: 1.1230 and major OB at 1.1070
Projectionion
- Continuation of Wave (5) can target 1.1600 -1.1650 (measured move from prior impulse).
- However, rejection from the red supply zone is likely in the short term, leading to a possible retracement back to 1.1275 -1.1230, before final
Strategy for the day:
- Watch for bearish rejection or candle confirmation at 1.1480 for potential short scalp toward 1.1270.
- If breaks and holds above 1.1480, look for bullish breakout trade toward 1.1600
Key levels
- Support: 1.1275 -1.1230 zone remains structurally important.
- Resistance: 1.1430 -1.1480 zone remains a decision point for continuation or pullback.
Trading outlook
|
Direction |
Entry |
Stop |
Target |
|---|---|---|---|
|
Short |
1.1430-1.1480 |
1.1500 |
1.1275-1.1230 |
|
Long |
Break above 1.1480 |
1.1400 |
1.1600-1.1650 |
WTI Crude Oil futures (CL July 2025 contract one-hour chart)
Structure
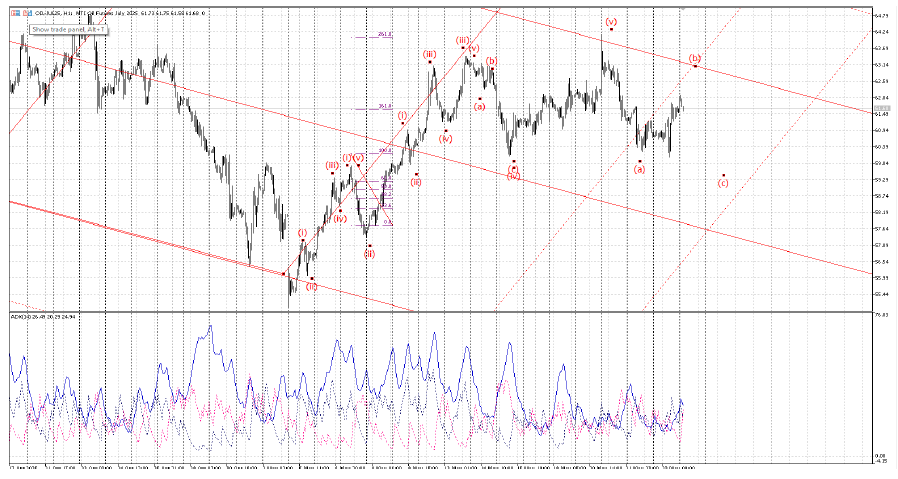
Crude oil responded positively to the tariff delay news, rebounding off the 60.20 support zone. The current correction appears to be completing a classic ABC pattern, with Wave C still unfolding.
Levels
- Resistance: 62.30 short term; 64.70 medium term resistance.
- Support: 58.00-57.00 remains the likely downside target for completion of the corrective wave
Bias
- ADX signals building strength in the downtrend.
- As long as price remains below 62.50, downside continuation remains the base case.
Trading outlook
|
Direction |
Entry |
Stop |
Target |
|---|---|---|---|
|
Short |
61.80-62.30 |
62.60 |
58.00-57.50 |
|
long |
On support at 58.00 |
56.90 |
61.00 (scalp rebound) |
Final note
S&P 500 Futures remain bearish below 5922, with further downside potential toward 5670. Euro FX maintains a bullish outlook but is approaching a critical decision zone between 1.1430 and 1.1480, which may determine the next move. Crude Oil shows some short-term upside due to macro relief, but the broader technical structure still suggests the correction may complete near the 57.00-58.00 range.
Author

Faysal Amin
Mind Vision Traders
Faysal Amin is a seasoned financial analyst and market strategist with over a decade of experience in global markets, including equities, forex, and commodities.


