Bastille Day Fires Up Markets
Good Morning Traders,
As of this writing 4:30 AM EST, here’s what we see:
US Dollar: Sept. USD is Up at 95.070.
Energies: Aug Crude is Up at 46.70.
Financials: The Sept 30 year bond is Up 5 ticks and trading at 152.25.
Indices: The Sept S&P 500 emini ES contract is 1 ticks Higher and trading at 2456.25.
Gold: The Aug gold contract is trading Up at 1229.50. Gold is 19 ticks Higher than its close.
Initial Conclusion
This is not a correlated market. The dollar is Up+ and Crude is Up+ which is not normal and the 30 year Bond is trading Higher. The Financials should always correlate with the US dollar such that if the dollar is lower then bonds should follow and vice-versa. The indices are Up+ and Crude is trading Up+ which is not correlated. Gold is trading Up+ which is not correlated with the US dollar trading Up+. I tend to believe that Gold has an inverse relationship with the US Dollar as when the US Dollar is down, Gold tends to rise in value and vice-versa. Think of it as a seesaw, when one is up the other should be down. I point this out to you to make you aware that when we don’t have a correlated market, it means something is wrong. As traders you need to be aware of this and proceed with your eyes wide open.
At this hour all of Asia is trading Higher except the Shanghai exchange which is lower. As of this broadcast Europe is trading mixed with half the exchanges trading Higher and the other half Lower.
Possible Challenges To Traders Today
– Empire State Mfg Index out at 8:30 AM EST. This is major.
– Lack of major economic news.
Treasuries
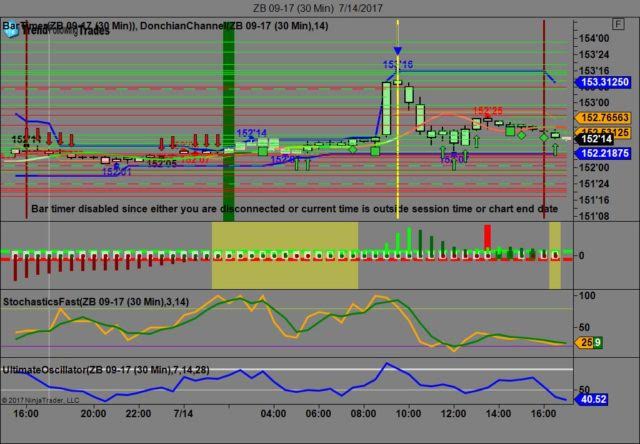
We’ve elected to switch gears a bit and show correlation between the 30 year bond (ZB) and The YM futures contract. The YM contract is the DJIA and the purpose is to show reverse correlation between the two instruments. Remember it’s liken to a seesaw, when up goes up the other should go down and vice versa.
On Friday the ZB made it’s move at around 9:30 AM EST right after the 8:30 AM news came out. The ZB hit a high at around that time and the YM hit a low. If you look at the charts below ZB gave a signal at around 9:30 AM and the YM was moving higher at the same time. Look at the charts below and you’ll see a pattern for both assets. ZB hit a high at around 9:30 AM and the YM hit a low. These charts represent the newest version of Trend Following Trades and I’ve changed the timeframe to a 30 minute chart to display better. This represented a shorting opportunity on the 30 year bond, as a trader you could have netted about 30 ticks per contract on this trade. Each tick is worth $31.25. We added a Donchian Channel to the charts to show the signals more clearly. Please note that the front month for the ZB contract is now September, 2017.
Charts Courtesy of Trend Following Trades built on a NinjaTrader platform.

Bias
On Friday we gave the markets a neutral bias as the markets had no sense of direction Friday morning. The Dow closed higher by 85 points and the other indices closed higher as well. Today we aren’t dealing with a correlated market and will maintain a neutral bias.
Could this change? Of Course. Remember anything can happen in a volatile market.
Commentary
Friday marked Bastille Day in France which is their equivalent to our Fourth of July. So El Presidente decides to fly to Paris on Air Force One and join the celebration. This is the same president that pushed the United States out of the Paris accord last month and yet he celebrating a French holiday. His comment to the French president’s wife wasn’t met with any fondness as most people thought he was judging one of his beauty contests. Be that as it may the markets rose in celebration. We took a neutral bias because Friday morning the USD and crude were both trading lower and in theory the indices should have been trading higher but weren’t. Hence the neutral bias. Today we only have one economic report: the Empire State Manufacturing Index which is major and a proven market mover but as in all things, time will tell…
Author

Nick Mastrandrea
Market Tea Leaves


