Back to NDX safe haven

S&P 500 rebounded on underwhelming JOLTS data just as I looked for the index to go up, overcame the key 4,575 support turned resistance, but got rejected at more crucial 4,585 level. The rally was driven by the Magnificent 7, resp. Nasdaq again – and there are signs Russell 2000 is starting to struggle. The pullback in cyclicals – where it matters most (KRE, XLF, XLI, XLRE) had been still orderly, which paints a bit confusing picture for quite a few days before the nonfarm payrolls and especially the nearest FOMC. Nimble traders have an advantage in the remaining days – unless you want to stick with the big picture assessment of mine – therefore, I‘ll present those views below as for clients as it would be impossible to capitalize on the moves thanks to daily articles only..
Let‘s move right into the charts – today‘s full scale article contains 5 of them, featuring S&P 500, credit markets, precious metals and oil.
Tired of seeing those red boxes instead of way more valuable information? Try the premium services based on what and how you trade.
Credit markets
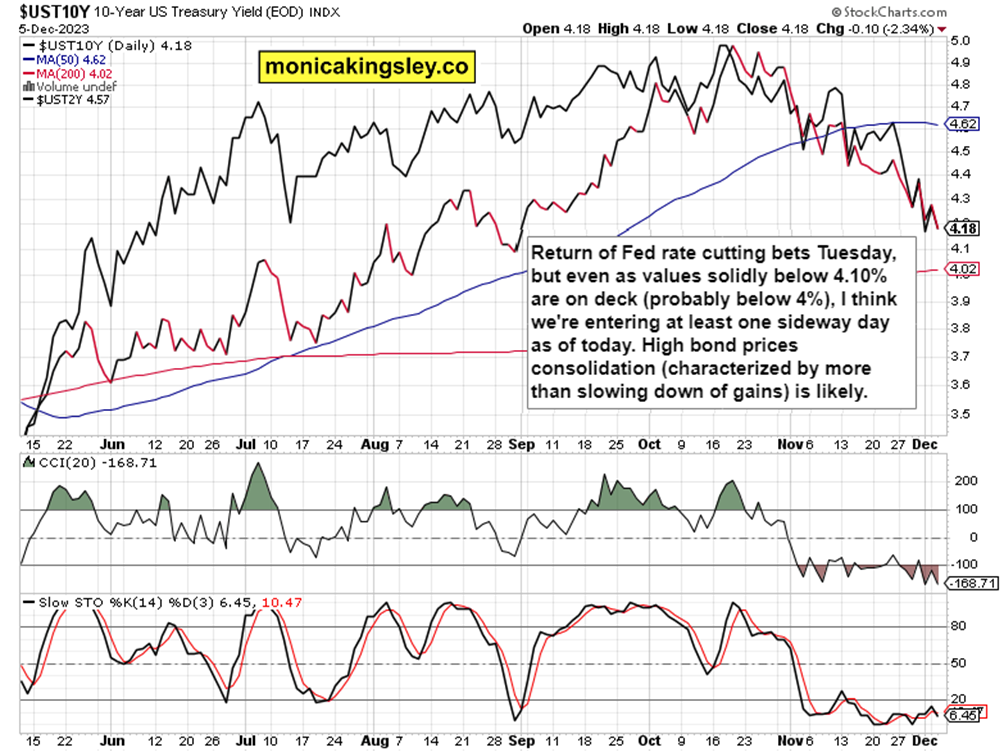
Bonds are strengthening, and risk taking is still getting rewarded. When the dollar start sputtering – that could be first close to EURUSD 1.0730 – I‘d be looking for yields to rise a bit for a short while again. The trend is though clear – yields are to be retreating.
Talking about rewarding risk taking still, junk bonds are to outperform quality (Treasury) ones – and now, we‘re on the doorstep of slowdown in these trades – one that wouldn‘t disrupt the upswing if you‘re patient (this year bonds are going up still).
Author

Monica Kingsley
Monicakingsley
Monica Kingsley is a trader and financial analyst serving countless investors and traders since Feb 2020.


