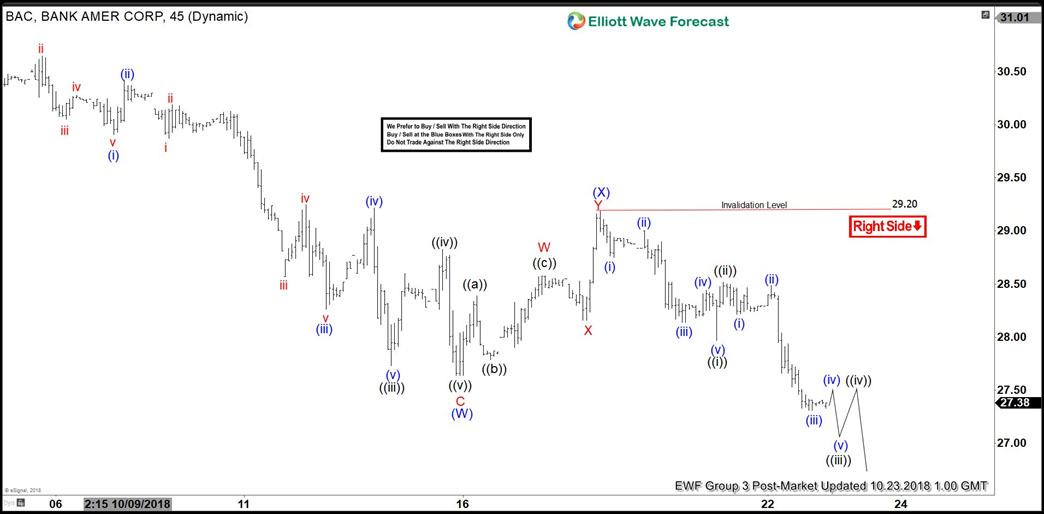
Bank of America Corporation ticker symbol: BAC short-term Elliott wave view suggests that a decline from 8/08/2018 high to $27.64 low ended intermediate wave (W). The internals of that decline unfolded in 3 swings with the distribution of 5-3-5 zigzag structure. Up from there, a bounce to $29.20 high ended the short-term correction against 8/08/2018 high in intermediate wave (X) as double three structure. Where Minor wave W ended in 3 swings at $28.58. Minor wave X pullback ended at 28.16 low and Minor wave Y ended at $29.20 high.

Down from there, intermediate wave (Y) remains in progress and a break below $27.64 last weeks low confirming the next extension lower. Down from $29.20 high, the lesser degree Minute wave ((i)) ended in 5 waves at $27.97. Minute wave ((ii)) bounce ended at $28.52 and Minute wave ((iii)) remain in progress looking to extend lower 1 more time. Afterwards, BAC is expected to do a Minute wave ((iv)) bounce before further downside in Minute wave ((v)) is seen to complete Minor wave A of a possible zigzag structure. We don’t like buying the stock and prefer more downside against $29.20 high.

BAC 1 Hour Elliott Wave Chart

chart

chart


Become a Successful Trader and Master Elliott Wave like a Pro. Start your Free 14 Day Trial at - Elliott Wave Forecast.


FURTHER DISCLOSURES AND DISCLAIMER CONCERNING RISK, RESPONSIBILITY AND LIABILITY Trading in the Foreign Exchange market is a challenging opportunity where above average returns are available for educated and experienced investors who are willing to take above average risk. However, before deciding to participate in Foreign Exchange (FX) trading, you should carefully consider your investment objectives, level of xperience and risk appetite. Do not invest or trade capital you cannot afford to lose. EME PROCESSING AND CONSULTING, LLC, THEIR REPRESENTATIVES, AND ANYONE WORKING FOR OR WITHIN WWW.ELLIOTTWAVE- FORECAST.COM is not responsible for any loss from any form of distributed advice, signal, analysis, or content. Again, we fully DISCLOSE to the Subscriber base that the Service as a whole, the individual Parties, Representatives, or owners shall not be liable to any and all Subscribers for any losses or damages as a result of any action taken by the Subscriber from any trade idea or signal posted on the website(s) distributed through any form of social-media, email, the website, and/or any other electronic, written, verbal, or future form of communication . All analysis, trading signals, trading recommendations, all charts, communicated interpretations of the wave counts, and all content from any media form produced by www.Elliottwave-forecast.com and/or the Representatives are solely the opinions and best efforts of the respective author(s). In general Forex instruments are highly leveraged, and traders can lose some or all of their initial margin funds. All content provided by www.Elliottwave-forecast.com is expressed in good faith and is intended to help Subscribers succeed in the marketplace, but it is never guaranteed. There is no “holy grail” to trading or forecasting the market and we are wrong sometimes like everyone else. Please understand and accept the risk involved when making any trading and/or investment decision. UNDERSTAND that all the content we provide is protected through copyright of EME PROCESSING AND CONSULTING, LLC. It is illegal to disseminate in any form of communication any part or all of our proprietary information without specific authorization. UNDERSTAND that you also agree to not allow persons that are not PAID SUBSCRIBERS to view any of the content not released publicly. IF YOU ARE FOUND TO BE IN VIOLATION OF THESE RESTRICTIONS you or your firm (as the Subscriber) will be charged fully with no discount for one year subscription to our Premium Plus Plan at $1,799.88 for EACH person or firm who received any of our content illegally through the respected intermediary’s (Subscriber in violation of terms) channel(s) of communication.

Recommended Content


Recommended Content

Editors’ Picks

EUR/USD clings to gains near 1.0700, awaits key US data

EUR/USD clings to gains near 1.0700, awaits key US data

EUR/USD clings to gains near the 1.0700 level in early Europe on Thursday. Renewed US Dollar weakness offsets the risk-off market environment, supporting the pair ahead of the key US GDP and PCE inflation data. 

EUR/USD News

USD/JPY keeps pushing higher, eyes 156.00 ahead of US GDP data

USD/JPY keeps pushing higher, eyes 156.00 ahead of US GDP data

USD/JPY keeps breaking into its highest chart territory since June of 1990 early Thursday, recapturing 155.50 for the first time in 34 years as the Japanese Yen remains vulnerable, despite looming intervention risks. The focus shifts to Thursday's US GDP report and the BoJ decision on Friday. 

USD/JPY News

Gold closes below key $2,318 support, US GDP holds the key

Gold closes below key $2,318 support, US GDP holds the key

Gold price is breathing a sigh of relief early Thursday after testing offers near $2,315 once again. Broad risk-aversion seems to be helping Gold find a floor, as traders refrain from placing any fresh directional bets on the bright metal ahead of the preliminary reading of the US first-quarter GDP due later on Thursday.

Gold News

Injective price weakness persists despite over 5.9 million INJ tokens burned

Injective price weakness persists despite over 5.9 million INJ tokens burned

Injective price is trading with a bearish bias, stuck in the lower section of the market range. The bearish outlook abounds despite the network's deflationary efforts to pump the price. 

Read more

Meta takes a guidance slide amidst the battle between yields and earnings

Meta takes a guidance slide amidst the battle between yields and earnings

Meta's disappointing outlook cast doubt on whether the market's enthusiasm for artificial intelligence. Investors now brace for significant macroeconomic challenges ahead, particularly with the release of first-quarter GDP data.

Read more

Majors

Cryptocurrencies

Signatures