AUD/JPY Elliott Wave technical analysis [Video]
![AUD/JPY Elliott Wave technical analysis [Video]](https://editorial.fxstreet.com/images/Markets/Currencies/Crosses/AUDJPY/forex-australia-and-japanese-currency-pair-with-calculator-4780678_XtraLarge.jpg)
AUD/JPY Elliott Wave technical analysis
Function: Counter Trend.
Mode: Impulsive.
Structure: blue wave 1.
Position: Black wave C.
Direction next higher degrees: Blue wave 2.
Details: Red wave C of Z looking completed at 99.095, now blue wave 1 is in play. Wave Cancel invalid level: 99.095.
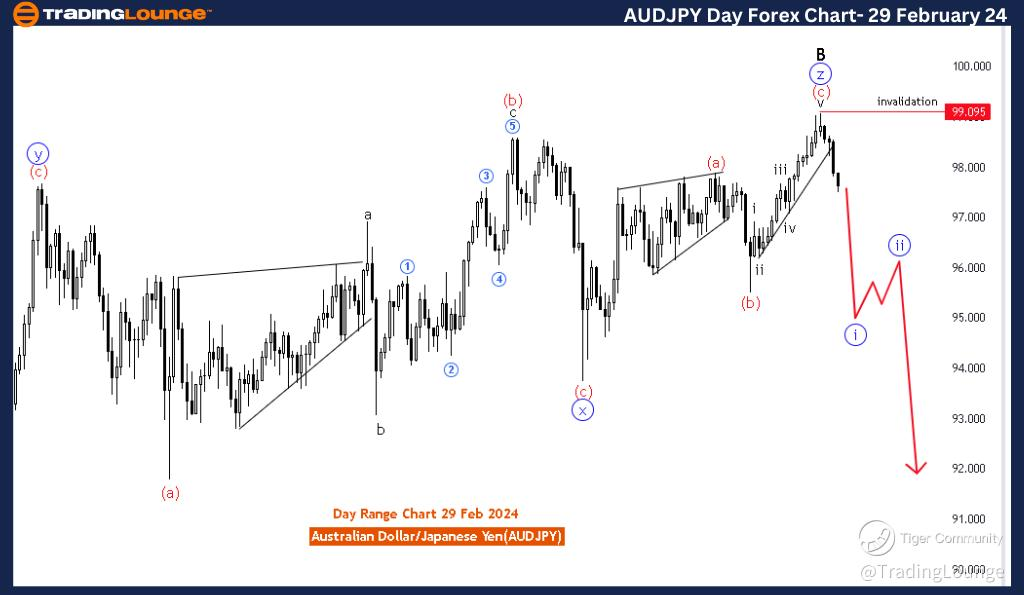
The "AUDJPY Elliott Wave Analysis Trading Lounge Day Chart" dated 29 February 24, provides a comprehensive analysis of the Australian Dollar/Japanese Yen (AUDJPY) currency pair using Elliott Wave theory. This analysis is conducted on the daily chart, offering a broader perspective.
The identified "FUNCTION" is "Counter Trend," suggesting a focus on identifying potential reversals or corrective phases in the market. This indicates a strategic approach that may involve taking positions contrary to the prevailing trend.
The specified "MODE" is "Impulsive," indicating that, despite the counter-trend focus, the current market conditions are characterized by strong, forceful, and directional price movements. This implies that within the counter-trend context, there might be substantial impulsive moves.
The described "STRUCTURE" is "Blue wave 1," representing the specific wave within the Elliott Wave hierarchy. Blue wave 1 typically signifies the initial leg of a larger impulsive move, suggesting the potential beginning of a new trend in the counter-trend context.
The identified "POSITION" is "Black wave C," denoting the current position within the broader Elliott Wave pattern. Black wave C is part of the larger structure and reflects the completion of a corrective phase, with the expectation of a subsequent impulsive move.
Regarding "DIRECTION NEXT HIGHER DEGREES," the focus is on "Blue wave 2." This suggests the anticipation of a corrective phase following the completion of Black wave C. Blue wave 2 is expected to be a temporary pullback against the prevailing counter-trend.
In the "DETAILS" section, it is noted that "Red wave C of Z looking completed at 99.095, now blue wave 1 is in play." This signifies the end of a complex correction labeled as Red wave C of Z and the initiation of a new counter-trend impulsive move, Blue wave 1.
The "Wave Cancel invalid level" is set at 99.095, serving as a critical reference point. A breach beyond this level would invalidate the current wave count, prompting a reassessment of the analysis.
In summary, the AUDJPY Elliott Wave Analysis for the daily chart on 29 February 24, indicates the completion of a corrective phase (Red wave C of Z) and the initiation of a new counter-trend impulsive move (Blue wave 1). Traders are advised to monitor the invalidation level at 99.095 for potential shifts in the wave count within the counter-trend context.
AUD/JPY day chart
AUD/JPY Elliott Wave technical analysis
Function: Trend.
Mode: Impulsive.
Structure: Red wave 1.
Position: Blue wave 1.
Direction next higher degrees: Red wave 2.
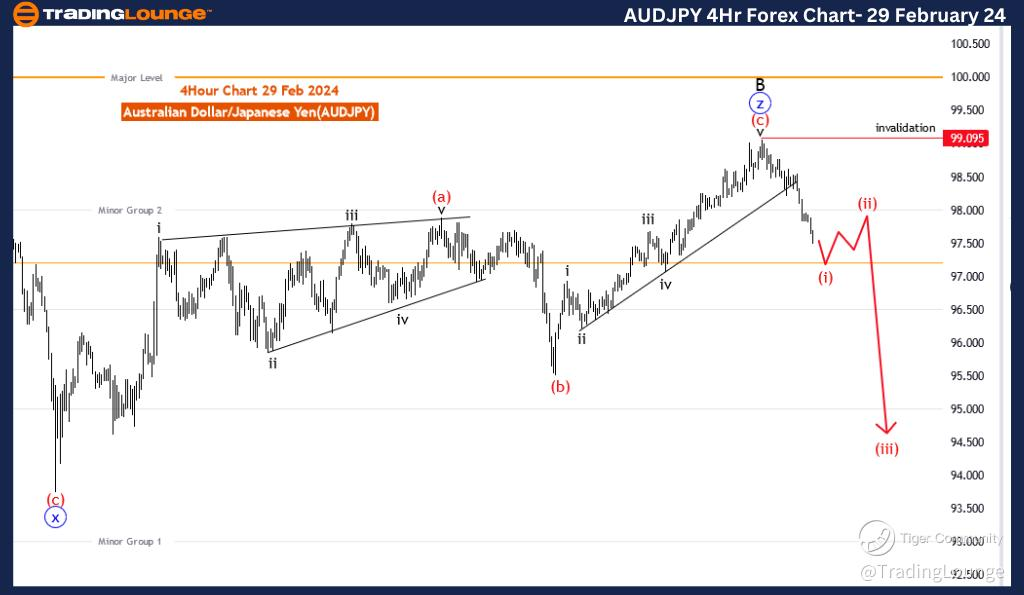
Details: Red wave C of Z looking completed at 99.095, now red wave 1 is in play . Wave Cancel invalid level: 99.095.
The "AUDJPY Elliott Wave Analysis Trading Lounge 4 Hour Chart" dated 29 February 24, provides an in-depth analysis of the Australian Dollar/Japanese Yen (AUDJPY) currency pair using Elliott Wave theory. The analysis is conducted on the 4-hour chart.
The identified "FUNCTION" is "Trend," indicating a focus on identifying and participating in the current directional movement of the market. This suggests a strategic approach aimed at capitalizing on sustained and directional price trends.
The specified "MODE" is "Impulsive," suggesting that the market is currently characterized by strong, forceful, and directional price movements. This type of market environment is conducive to trend-following strategies.
The described "STRUCTURE" is "Red wave 1," denoting the specific wave within the Elliott Wave hierarchy. Red wave 1 typically represents the initial phase of a larger impulsive move, indicating the potential beginning of a new trend.
The identified "POSITION" is "Blue wave 1," indicating the current position within the broader Elliott Wave pattern. Blue wave 1 is part of the larger Red wave 1 and signifies the initial leg of the impulsive move.
Regarding "DIRECTION NEXT HIGHER DEGREES," the focus is on "Red wave 2," suggesting the anticipated correction within the larger impulsive move (Red wave 1). This correction is expected to be a temporary pullback against the prevailing trend.
The "DETAILS" section notes that "Red wave C of Z looking completed at 99.095, now red wave 1 is in play." This suggests the completion of a complex correction labeled as Red wave C of Z and the initiation of the impulsive move Red wave 1.
The "Wave Cancel invalid level" is set at 99.095, serving as a critical reference point. A breach beyond this level would invalidate the current wave count, prompting a reevaluation of the analysis.
In summary, the AUDJPY Elliott Wave Analysis for the 4-hour chart on 29 February 24, indicates the completion of a corrective phase (Red wave C of Z) and the initiation of a new impulsive move (Red wave 1).
Traders are advised to monitor the invalidation level at 99.095 for potential shifts in the wave count.
AUD/JPY four hour chart
Author

Peter Mathers
TradingLounge
Peter Mathers started actively trading in 1982. He began his career at Hoei and Shoin, a Japanese futures trading company.


