August starts illy for gold, could September change anything?

The WGC believes that gold will shine in September. Given the whole context, I’m not so sure – in fact, not sure at all.
Following three previous reports, the WGC revealed two more interesting publications at the turn of July and August. The first one is the report about gold demand trends in Q2 2021. As we can read, the demand for gold was virtually flat in Q2 (y-o-y), but in the first half of the year it decreased 10.4%. Importantly, there were modest inflows into gold ETFs in Q2 and also in July, but they only partially offset the huge outflows of the previous quarter. Hence, investors’ sentiment turned more positive in the second quarter, which helped gold prices rebound somewhat after Q1.
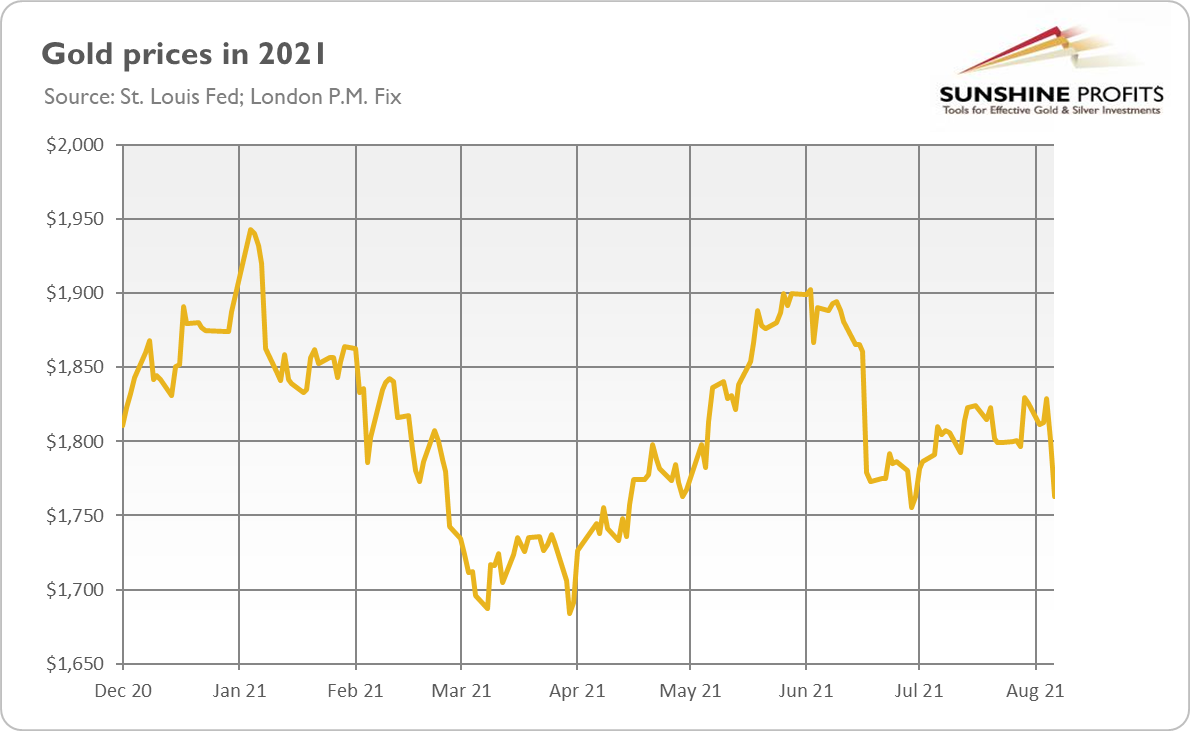
Indeed, as the chart below shows, the price of gold plunged 10% in Q1 2021. Then, it rebounded 4.3% in the second quarter, but it was not enough to offset the blow from the first three months of the year. In July, the price of gold jumped 3.6%, although it retraced most of that increase in August (it decreased 2.1% in a single day – Aug. 6). So, gold prices declined more than 6% year-to-date.
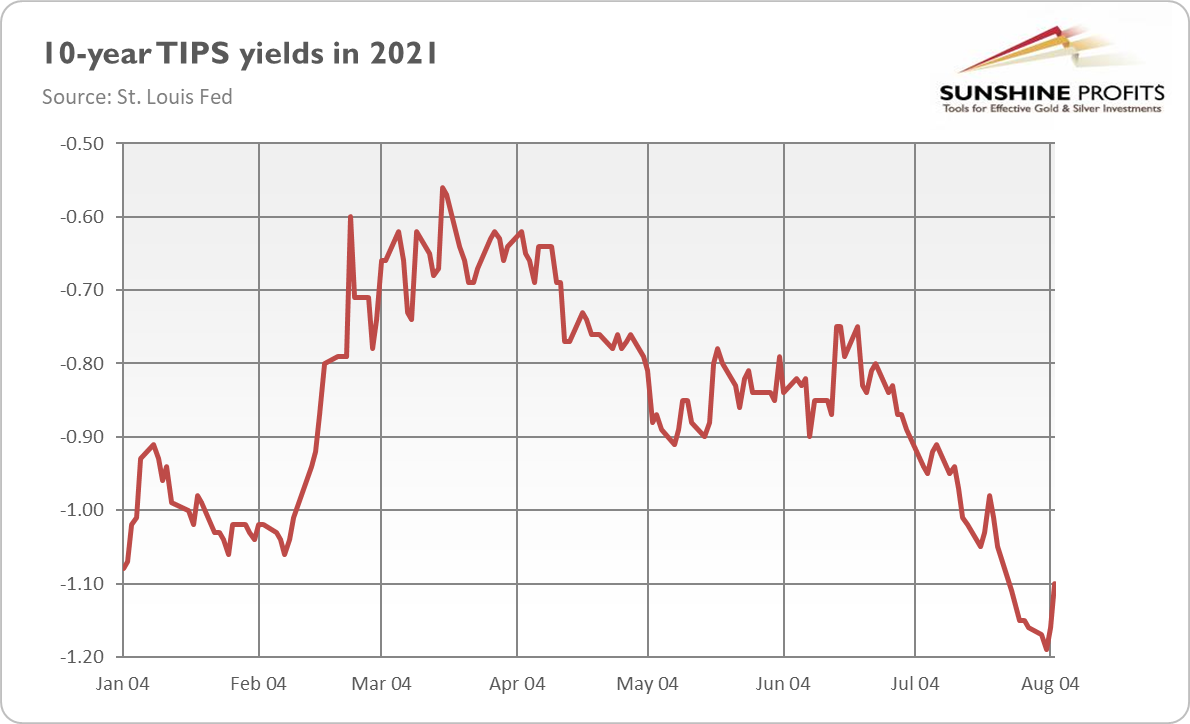
Unfortunately, there is potential for further declines. After strong July’s nonfarm payrolls, the Fed has no excuses not to start tapering of its quantitative easing. What’s more, the current levels of the real interest rates are very low, so they are likely to normalize somewhat later this year.
The second WGC publication is the newest edition of the Gold Market Commentary entitled Equity yields support gold as investors position for historical September strength. The main thesis of the article is that “August could be the opportune time to position for the historically strong September gold performance”. Well, given last week’s plunge in gold prices, this suggestion looks rather amusing, but who knows? There is plenty of time until September, which is historically quite positive for gold.
The justification for this thesis is two-fold. First, central banks focus now more on employment than inflation, which could prolong tapering activity. It’s true that the upcoming Fed’s tightening cycle will be very gradual, and the Fed’s balance sheet (as well as the federal funds rate) won’t probably return to the pre-pandemic levels. However, it’s also true that the Fed has already started the tapering clock and will likely tighten its monetary policy somewhat this year. This is what the markets are pricing in, and such expectations boost the real interest rates and create downward pressure on gold prices.
Second, the S&P 500’s real yield (i.e., companies’ earnings yield plus the dividend yield minus inflation) has turned negative, which reduces the opportunity costs of holding gold. Well, the equity market looks overbought, but with low interest rates, high inflation and the Fed always ready to reach out a helping hand, investors may continue to flow into this market.
Implications for gold
What can we learn from the recent World Gold Council reports? Well, just like the WGC, I’m bullish on gold in the long run, but I’m more bearish in the shorter timeframe. In other words, I believe that gold may go down first before it rallies again. September is a historically good month for gold, but this year it might also be the month when the Fed announces the start of the tapering of its asset purchases. The hawkish Fed would push bond yields higher and strengthen the dollar, sending the price of the yellow metal down in the short-to-medium term.
Luckily, an abrupt taper tantrum similar to the one from 2013 is not likely to happen again. Moreover, a bit later either the post-tightening recession or inflation running out of control could make gold shine again. After all, inflation is well above the Fed’s target, while the real yields will likely remain negative for a long period. These factors should provide support for gold over a longer horizon, but investors shouldn’t downplay the upcoming tightening cycle and rising interest rates.
Want free follow-ups to the above article and details not available to 99%+ investors? Sign up to our free newsletter today!
Want free follow-ups to the above article and details not available to 99%+ investors? Sign up to our free newsletter today!
Author

Arkadiusz Sieroń
Gold Price Forecast
Arkadiusz Sieroń received his Ph.D. in economics in 2016 (his doctoral thesis was about Cantillon effects), and has been an assistant professor at the Institute of Economic Sciences at the University of Wrocław since 2017.


