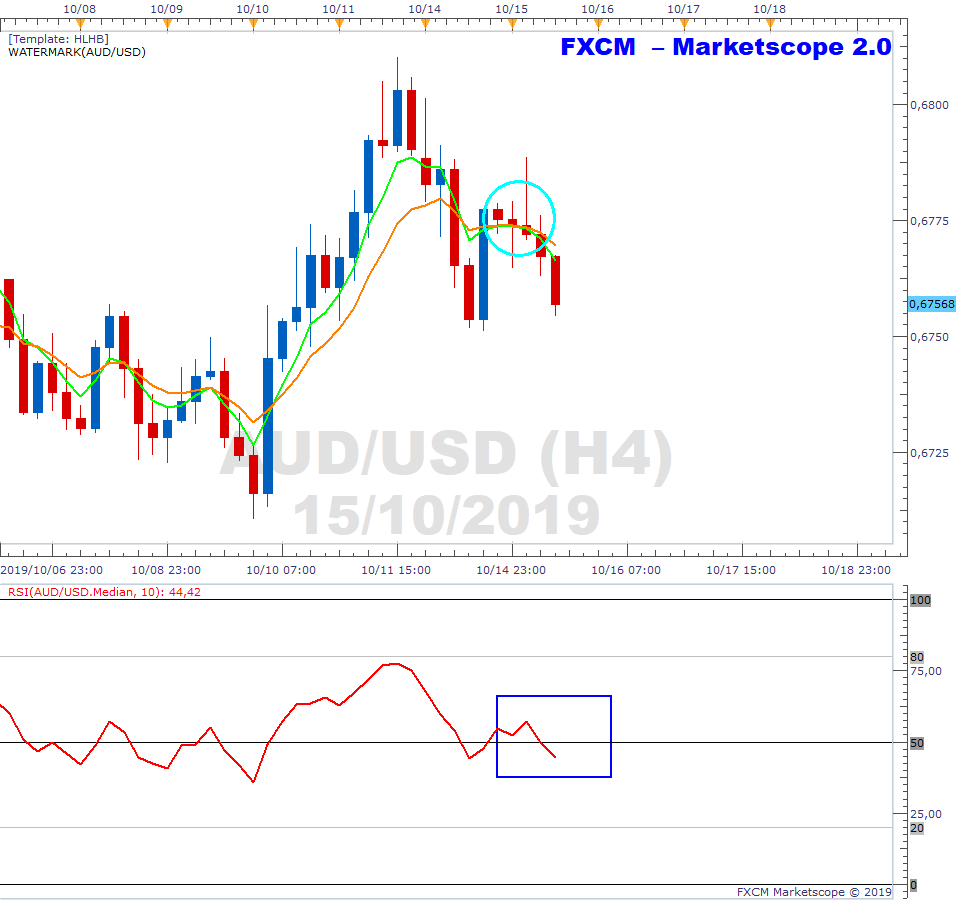
The below is the H4 chart of the AUDUSD. The green 5-period EMA has crossed below the orange 10-period EMA (aqua ellipse) and the RSI has moved to the bearish side of 50 (blue rectangle). The EMAs are also showing angle and separation which is a further bearish development. We note that the RBA minutes were dovish and indicated that the central banks will ease further to support jobs and growth if needed. We continue to monitor.
Past performance is not an indicator of future results.
CHART SOURCE: FXCM MARKETSCOPE 2.0
Recommended Content
Editors’ Picks
AUD/USD: Extra gains in the pipeline above 0.6520
AUD/USD partially reversed Tuesday’s strong pullback and regained the 0.6500 barrier and beyond in response to the sharp post-FOMC pullback in the Greenback on Wednesday.
EUR/USD meets support around 1.0650
EUR/USD managed to surpass the key 1.0700 barrier in response to the intense retracement in the US Dollar in the wake of the Fed’s interest rate decision and Chair Powell’s press conference.
Gold surpasses $2,300 as Dollar tumbles
The precious metal maintains its constructive stance and trespasses the $2,300 region on Wednesday after the Federal Reserve left its FFTR intact, matching market expectations.
Bitcoin price reclaims $59K as Fed leaves rates unchanged
The market was at the edge of its seat on Wednesday to see whether the US Federal Reserve (Fed) would cut interest rates during the Federal Open Market Committee (FOMC) meeting.
The market welcomes the Fed's statement
The market has welcomed the Fed statement, and the S&P 500 is higher in its aftermath, the dollar is lower and Treasury yields are falling. There is still only one cut priced in by the Fed.