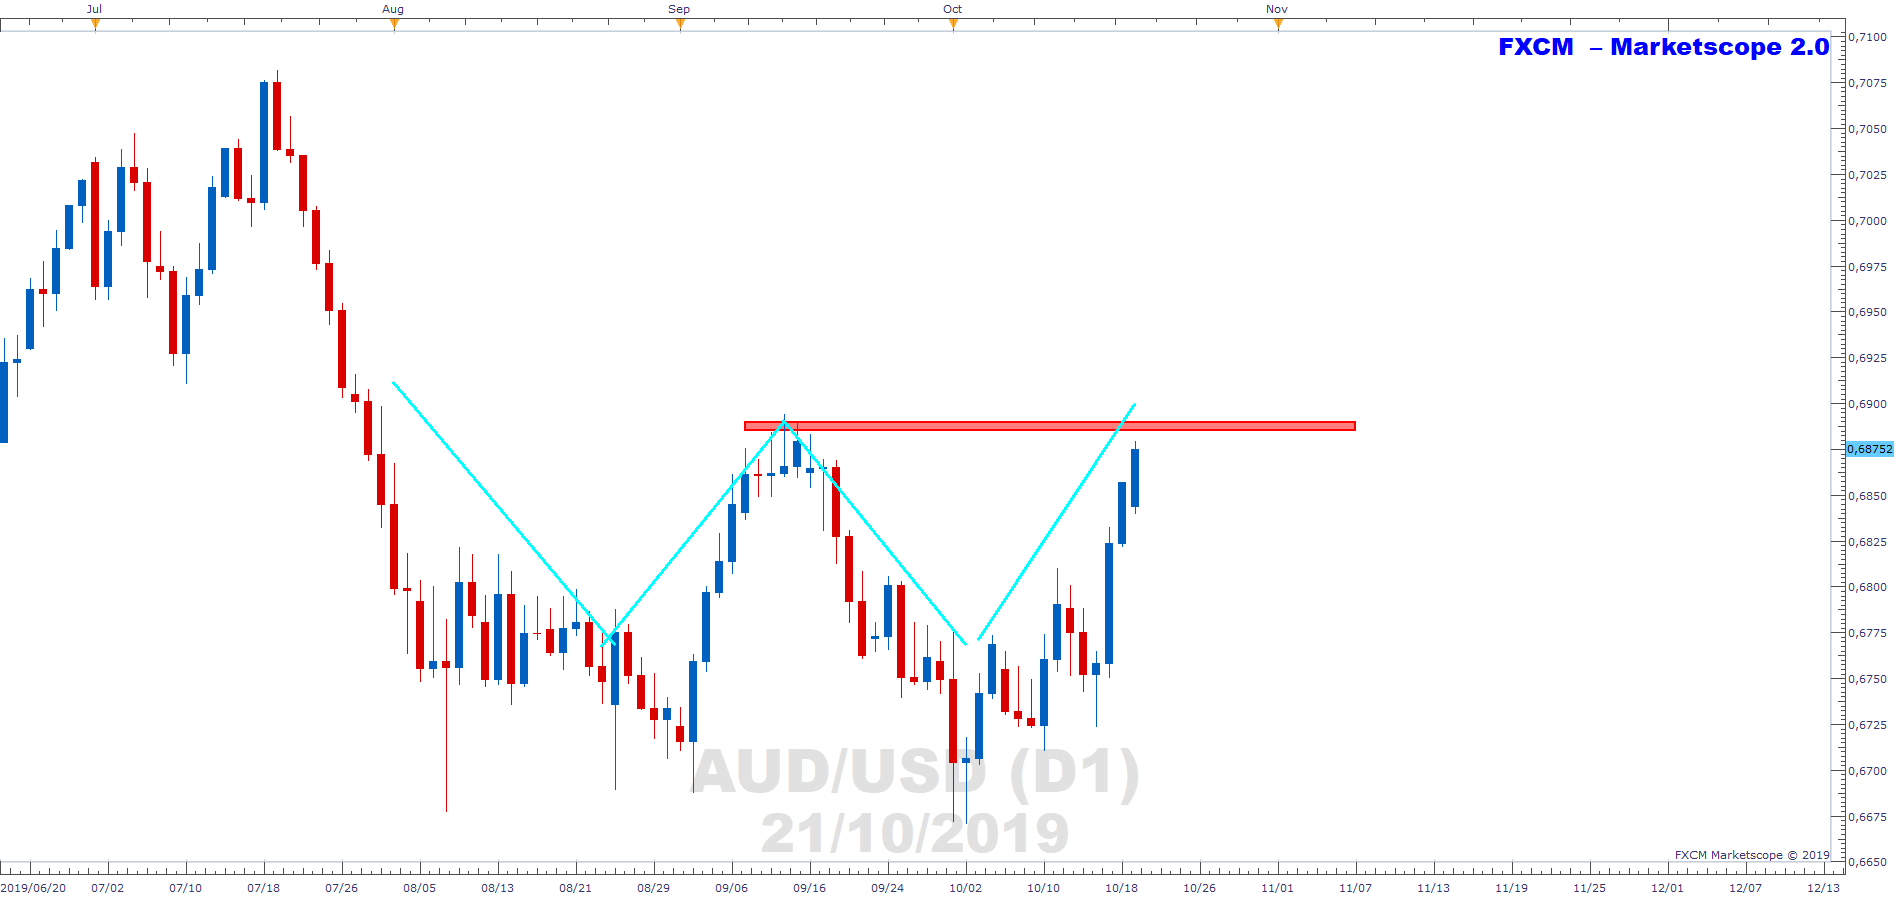
AUD/USD Looking to Double Bottom on Daily
The below is the daily chart of the AUDUSD. The currency pair is very close to charting a double bottom (aqua lines). To complete the pattern, price needs to break above the red shaded horizontal i.e. the neckline of the pattern. As US data came in fairly poorly (PMIs, low wage growth, inflation lower than target, poor retail numbers), the Australian economy seems to have responded to the RBA’s cuts i.e. unemployment – a major data reference for the RBA – came in better than expected at 5.2% (5.3%) As such the currency pair seems to be responding to a potentially more dovish Fed and a less dovish RBA. We continue to monitor.
Past performance is not an indicator of future results.
CHART SOURCE: FXCM MARKETSCOPE 2.0
Author

Russell Shor (MSTA, CFTe, MFTA) has an Honours Degree in Economics from the University of South Africa and holds the coveted Certified Financial Technician and Master of Financial Technical Analysis qualifications from the Interna


