WTI oil futures signal continuation of brutal selloff [Video]
![WTI oil futures signal continuation of brutal selloff [Video]](https://editorial.fxstreet.com/images/Markets/Currencies/Majors/AUDUSD/macro-of-aussie-100-note-8615104_XtraLarge.jpg)
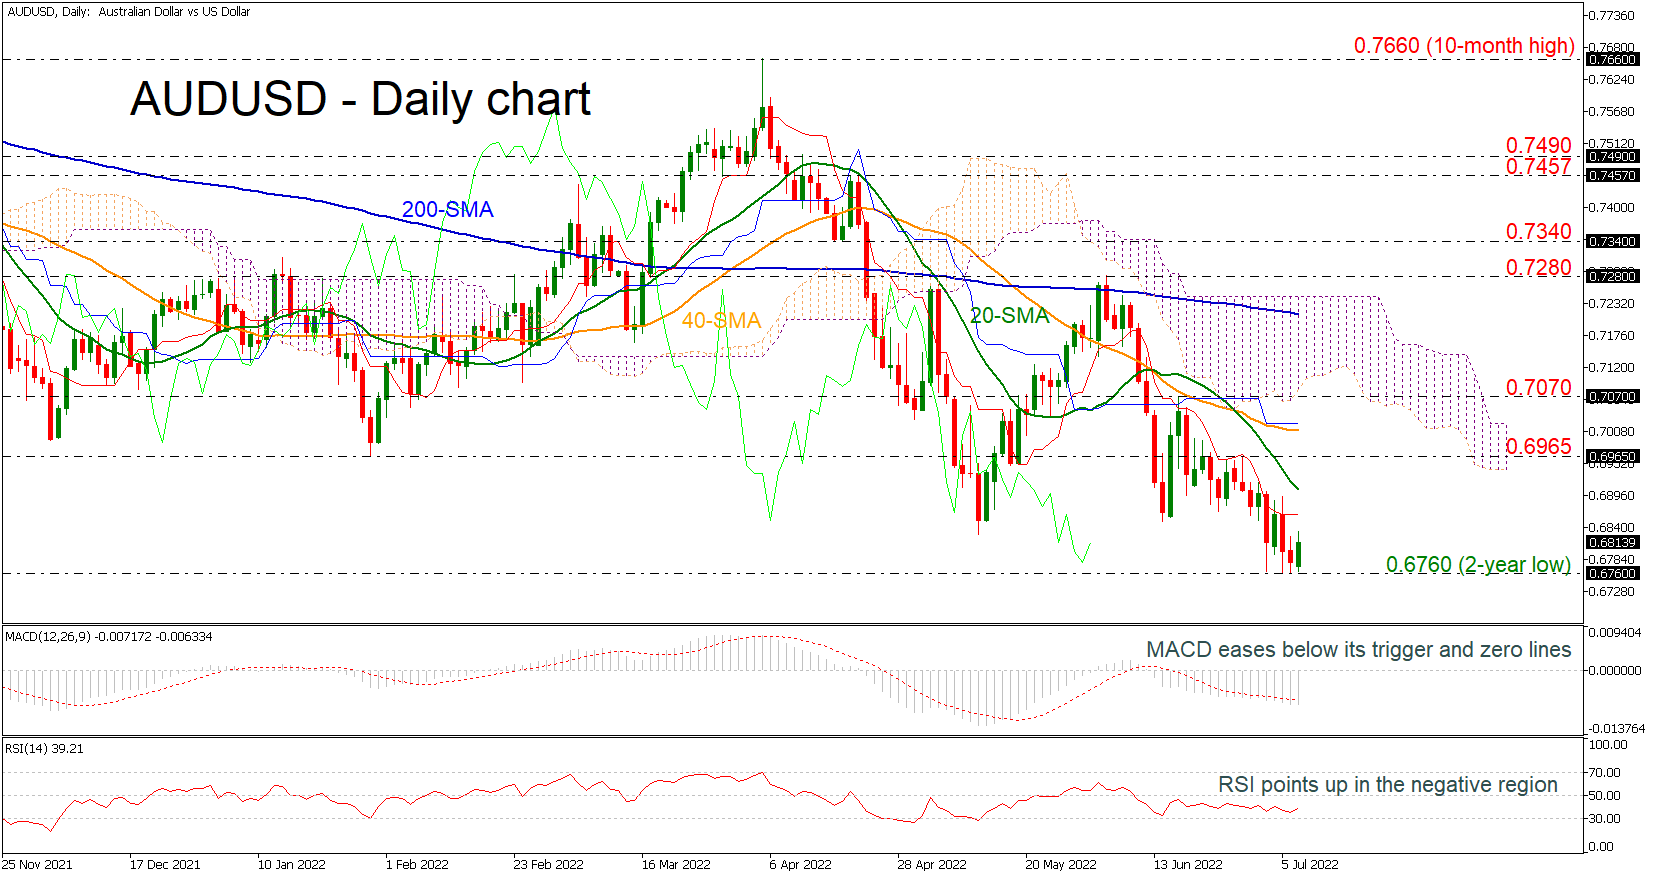
AUD/USD bounces off 2-year low but bearish bias remains
AUDUSD is showing some improvement after the selling interest towards the two-year low of 0.6760. The pair may reach oversold levels according to the RSI and reversed higher just before posting a lower low.
While the aforementioned technical indicator continues to slow down, mirroring the market’s bearish behavior over the past month, the indicator is still moving in negative territory, flagging that a downside move could reemerge in the short term. The MACD is also holding below its red signal line, which supports the bearish view as well, while the 20-day SMA keeps increasing its distance below the 50-day SMA, suggesting that the recent downtrend is likely to stay in place for now.
In case the pair changes its short-term direction to the downside, the bears will probably challenge the next support, which is an inside swing high at 0.6570, reached in April 2020. A break lower, could last until 0.6250, taken from the low in April 2020.
Alternatively, a move higher may drive the price towards the 20-day SMA at 0.6905 ahead of the 0.6965 resistance. Above the latter, the 40-day SMA at 0.7010 could come into view before meeting the lower surface of the Ichimoku cloud at 0.7070 and the 200-day SMA at 0.7215.
Summarizing, AUDUSD maintains a bearish bias in the short-term picture and only a decisive close beyond the 200-day SMA may switch the outlook to positive.
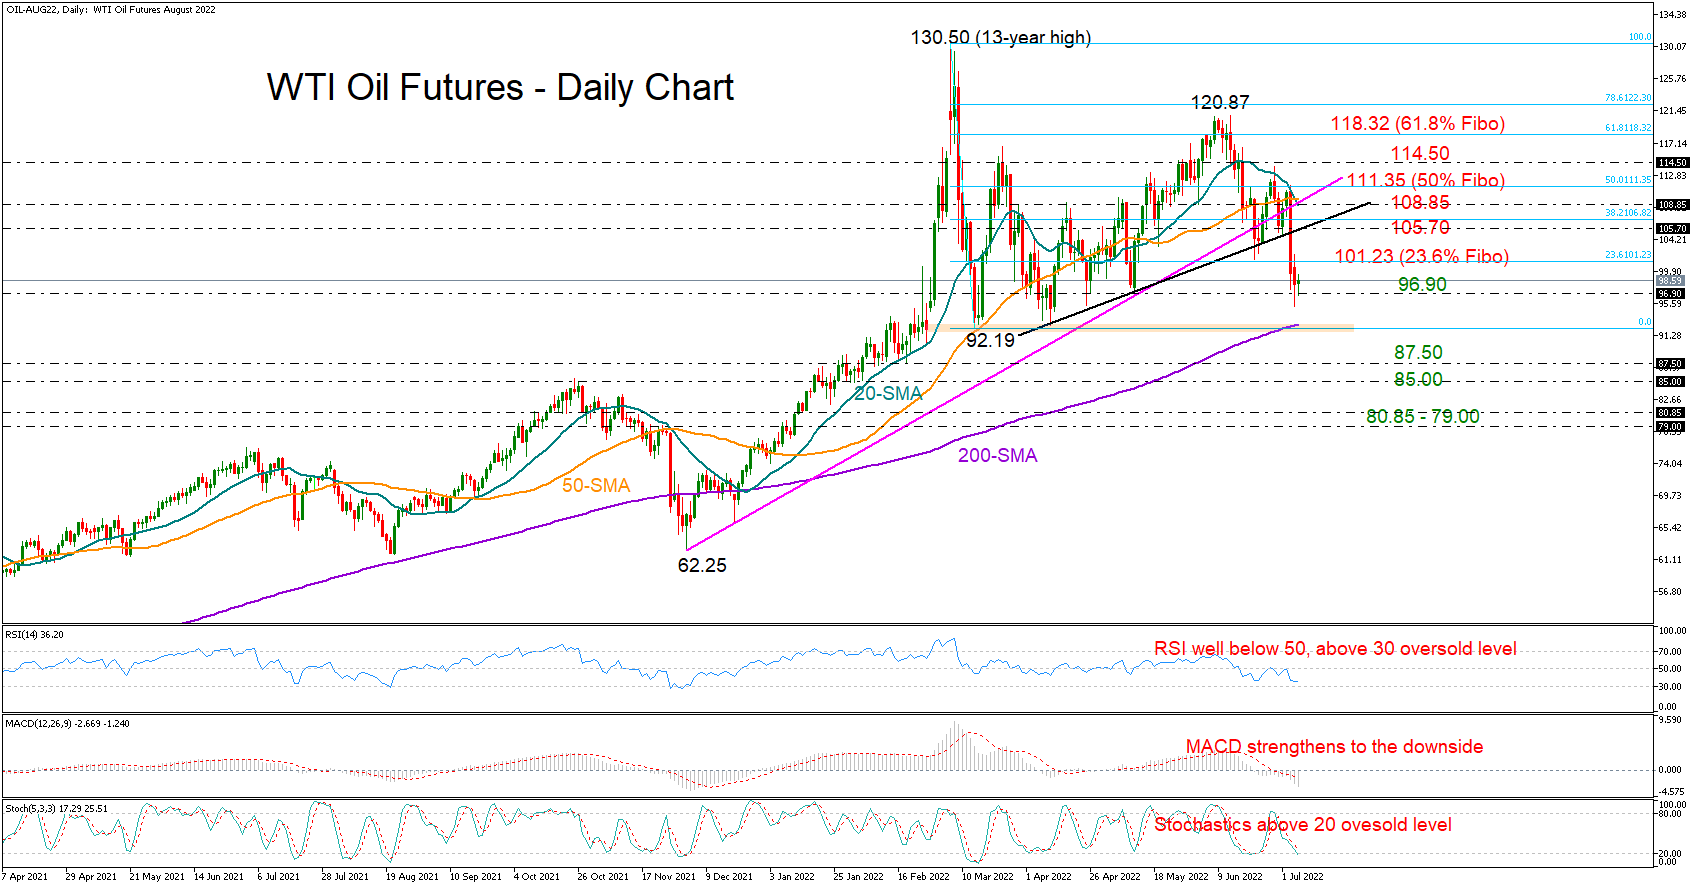
WTI oil futures signal continuation of brutal selloff
WTI oil futures (August delivery) are set to conclude their worst week since March, having plummeted by nearly 10% below trendlines and simple moving averages (SMAs) to hit a three-month low of $95.15/ barrel on Wednesday.
The price is currently trading marginally higher, trying to preserve some strength above May’s low, but the technical indicators are playing down any meaningful upturn. Particularly, the RSI and the Stochastics have yet to enter oversold waters, while the MACD remains negatively charged below its zero and signal lines, all foreseeing more losses ahead. Traders are also waiting to see whether the 20- and 50-day SMAs will defend their recent bearish cross in the short-term and therefore flag a trend deterioration.
Should selling forces resurface below $96.90, all attention will turn to the 200-day SMA and the $92.19 level, which is the base of the four-month-old range area. A decisive step lower from here could immediately stall within the $87.50 – $85.00 constraining zone, while a faster decline could cease somewhere between $80.85 and $79.00.
In the event of an upside reversal, the bulls will need to successfully pierce the 23.6% Fibonacci retracement of the $130.50 – $92.19 downfall at $101.23 to retest the broken trendlines within the $105.70 – $108.85 region. The resistance around the 50% Fibonacci of $111.35 may also guard against further positive corrections to $114.50.
All in all, the sell-off in WTI oil futures is expected to gain more legs in the short term, likely bringing the 200-day SMA and the lower boundary of the neutral area at $92.19 under examination.
Author

Melina joined XM in December 2017 as an Investment Analyst in the Research department. She can clearly communicate market action, particularly technical and chart pattern setups.


