Hello fellow traders.  Another pair we have traded lately is AUDCAD. As our members know, AUDCAD is having incomplete bullish sequences in the 1 Hour cycle and suggesting further rally.
Due to incomplete structure the pair is targeting 1.0212+ area according to Sequence Report.  Consequently, we advised clients to avoid selling the pair and keep on buying the dips in the sequences of 3,7,or 11 swings whenever there was an opportunity to do so.

Now, let’s take a look at the past Elliott Wave charts of  AUDCAD published in members area of the website.

AUDCAD 1 Hour Elliott Wave Analysis 3.8.2018

As we can see on the charts bellow, the pair is currently correcting the cycle from the 0.98711 low.  Wave X red pull back is in progress, unfolding as Double Three Structure ( 7 swings pattern).  It’s sub-divisons are labeled as ((w))-((x))-((y)) black . Currently the sequences of the pull back looks incomplete as we have 5 swings to the downside. We’re missing another leg toward 1.0089-1.00135 area which should complete proposed Elliott Wave structure. Short term view suggests we’re still in ((y)) leg that can reach the area shown in the lower blue box. We don’t recommend selling it against the main bullish trend and favor the long side, buying the dips at 1.0089-1.00135 area .  Invalidation for the long trades is break below 1.618 Fibonacci extension (0.9987).

AUDCAD

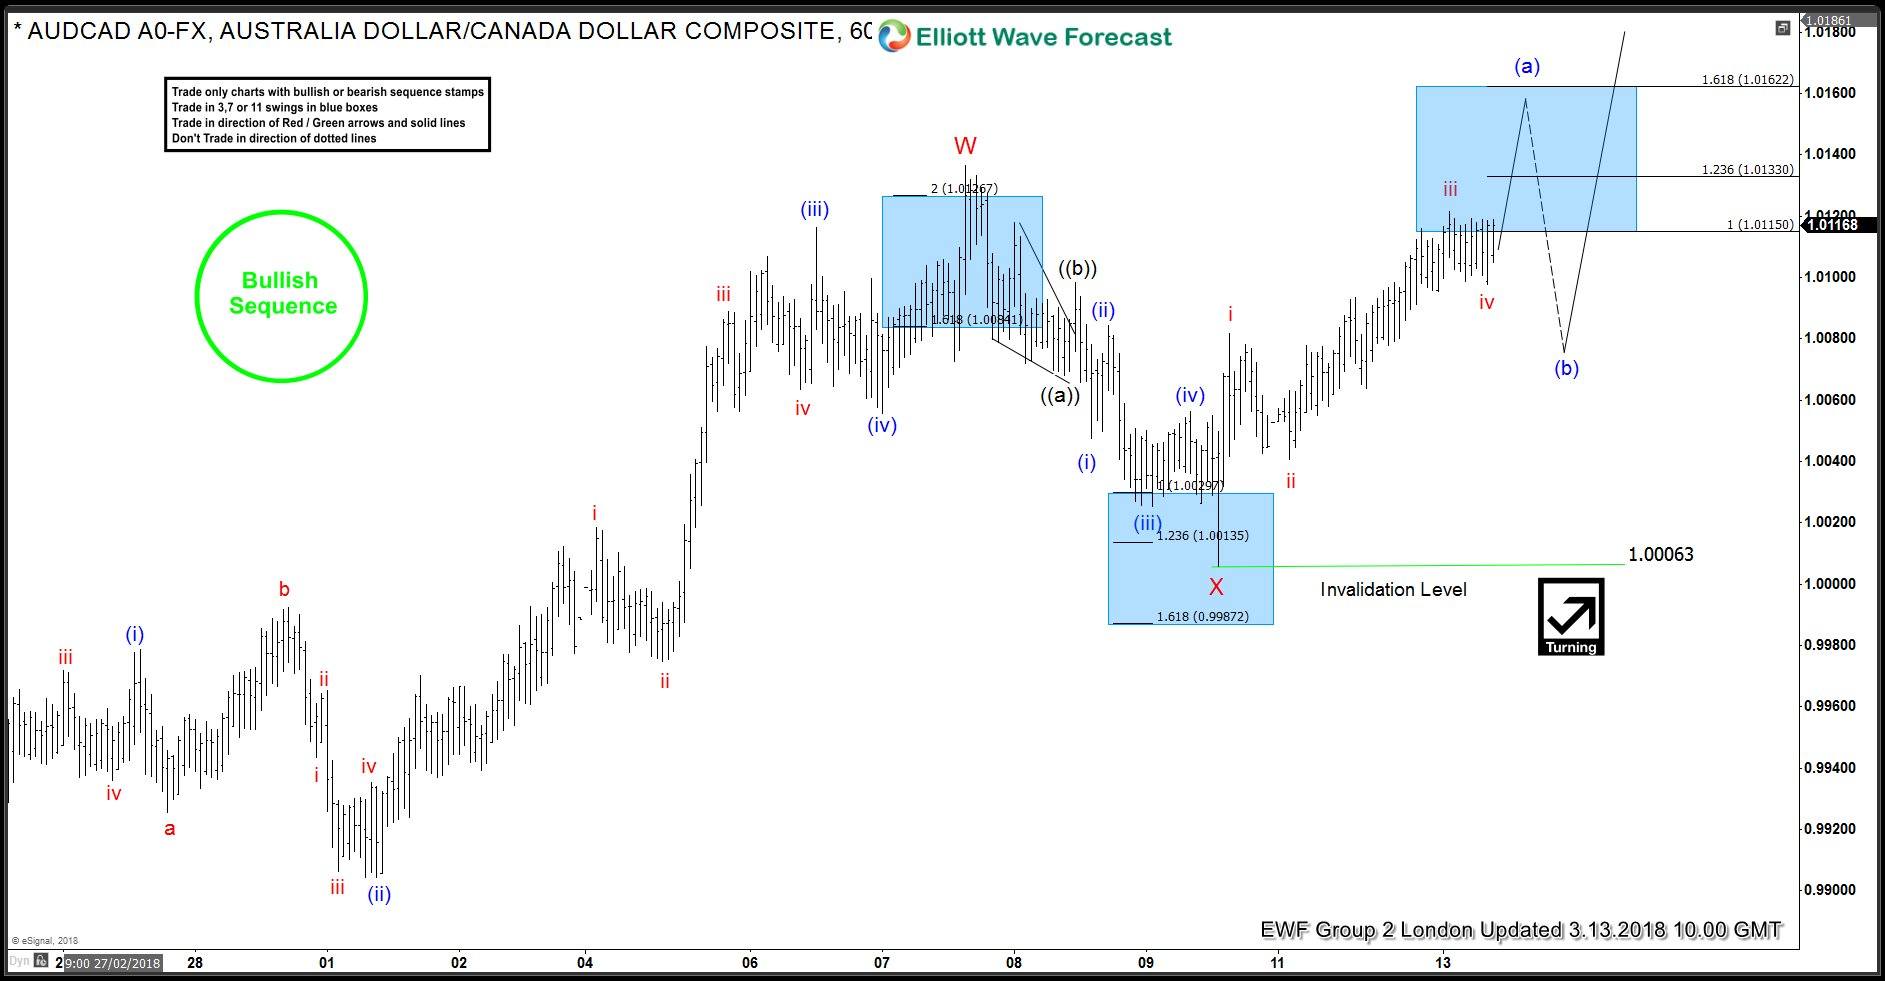
AUDCAD 1 Hour Elliott Wave Analysis 3.13.2018

We got proposed push lower toward our buying zone as expected.  AUDCAD found buyers there and gave us a nice reaction to the upside as expected.  As a result, members who bought the pair in the mentioned area are now enjoying profits with risk free positions. While above 1.00063 low, pull back X red is counted completed there , however we would like to see break above W red peak, to get confirmation that next leg higher is in progress. Currently, the price is at  the extremes from the mentioned  low at 1.0115-1.0162.  We can get 3 waves pull back before further rally resumes.   Keep in mind market is very dynamic and short term view could have changed or not be valid any more when you look at this chart but if you’re interested in more updates in this pair and new trading setups, you can find them in the membership area of EWF.

AUDCAD


Become a Successful Trader and Master Elliott Wave like a Pro. Start your Free 14 Day Trial at - Elliott Wave Forecast.

FURTHER DISCLOSURES AND DISCLAIMER CONCERNING RISK, RESPONSIBILITY AND LIABILITY Trading in the Foreign Exchange market is a challenging opportunity where above average returns are available for educated and experienced investors who are willing to take above average risk. However, before deciding to participate in Foreign Exchange (FX) trading, you should carefully consider your investment objectives, level of xperience and risk appetite. Do not invest or trade capital you cannot afford to lose. EME PROCESSING AND CONSULTING, LLC, THEIR REPRESENTATIVES, AND ANYONE WORKING FOR OR WITHIN WWW.ELLIOTTWAVE- FORECAST.COM is not responsible for any loss from any form of distributed advice, signal, analysis, or content. Again, we fully DISCLOSE to the Subscriber base that the Service as a whole, the individual Parties, Representatives, or owners shall not be liable to any and all Subscribers for any losses or damages as a result of any action taken by the Subscriber from any trade idea or signal posted on the website(s) distributed through any form of social-media, email, the website, and/or any other electronic, written, verbal, or future form of communication . All analysis, trading signals, trading recommendations, all charts, communicated interpretations of the wave counts, and all content from any media form produced by www.Elliottwave-forecast.com and/or the Representatives are solely the opinions and best efforts of the respective author(s). In general Forex instruments are highly leveraged, and traders can lose some or all of their initial margin funds. All content provided by www.Elliottwave-forecast.com is expressed in good faith and is intended to help Subscribers succeed in the marketplace, but it is never guaranteed. There is no “holy grail” to trading or forecasting the market and we are wrong sometimes like everyone else. Please understand and accept the risk involved when making any trading and/or investment decision. UNDERSTAND that all the content we provide is protected through copyright of EME PROCESSING AND CONSULTING, LLC. It is illegal to disseminate in any form of communication any part or all of our proprietary information without specific authorization. UNDERSTAND that you also agree to not allow persons that are not PAID SUBSCRIBERS to view any of the content not released publicly. IF YOU ARE FOUND TO BE IN VIOLATION OF THESE RESTRICTIONS you or your firm (as the Subscriber) will be charged fully with no discount for one year subscription to our Premium Plus Plan at $1,799.88 for EACH person or firm who received any of our content illegally through the respected intermediary’s (Subscriber in violation of terms) channel(s) of communication.

Recommended Content


Recommended Content

Editors’ Picks

EUR/USD edges lower toward 1.0700 post-US PCE

EUR/USD edges lower toward 1.0700 post-US PCE

EUR/USD stays under modest bearish pressure but manages to hold above 1.0700 in the American session on Friday. The US Dollar (USD) gathers strength against its rivals after the stronger-than-forecast PCE inflation data, not allowing the pair to gain traction.

EUR/USD News

GBP/USD retreats to 1.2500 on renewed USD strength

GBP/USD retreats to 1.2500 on renewed USD strength

GBP/USD lost its traction and turned negative on the day near 1.2500. Following the stronger-than-expected PCE inflation readings from the US, the USD stays resilient and makes it difficult for the pair to gather recovery momentum.

GBP/USD News

Gold struggles to hold above $2,350 following US inflation

Gold struggles to hold above $2,350 following US inflation

Gold turned south and declined toward $2,340, erasing a large portion of its daily gains, as the USD benefited from PCE inflation data. The benchmark 10-year US yield, however, stays in negative territory and helps XAU/USD limit its losses. 

Gold News

Bitcoin Weekly Forecast: BTC’s next breakout could propel it to $80,000 Premium

Bitcoin Weekly Forecast: BTC’s next breakout could propel it to $80,000

Bitcoin’s recent price consolidation could be nearing its end as technical indicators and on-chain metrics suggest a potential upward breakout. However, this move would not be straightforward and could punish impatient investors. 

Read more

Week ahead – Hawkish risk as Fed and NFP on tap, Eurozone data eyed too

Week ahead – Hawkish risk as Fed and NFP on tap, Eurozone data eyed too

Fed meets on Wednesday as US inflation stays elevated. Will Friday’s jobs report bring relief or more angst for the markets? Eurozone flash GDP and CPI numbers in focus for the Euro.

Read more

Majors

Cryptocurrencies

Signatures