AUD/USD: Rejected at technical cluster, has room to the downside - Confluence Indicator

The Technical Confluences Indicator shows a dense cluster of indicators around A$0.7710-0.7713 on the AUD/USD. The indicators include the Fibo 38.2% 1d, the Bolinger Bands 1d-Lower Stdv 2.2, SMA 5-4h, SMA200-15m, the SMA50-1h and more.
The pair traded around this cluster and was rejected, falling below 0.7700. The next cluster of confluences appears only at 0.7662. This includes the PP 1M S1, the Fibo 161.8% 1d and more.
Below this cluster of technical levels, the road is open towards 0.7500. On the topside, a confluence of indicators awaits only at 0.7778.
Here is how it looks on the tool:
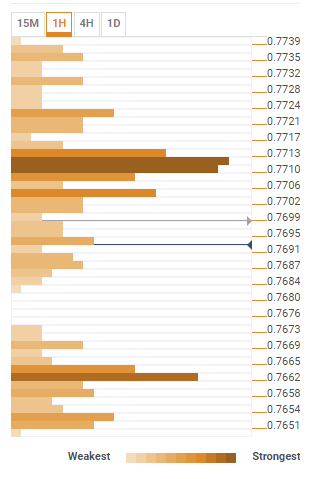
The TC is a tool to locate and point out those price levels where there is a congestion of indicators, moving averages, Fibonacci levels, Pivot Points, etc. Knowing where these congestion points are located is very useful for the trader, and can be used as a basis for different strategies.
Author

Yohay Elam
FXStreet
Yohay is in Forex since 2008 when he founded Forex Crunch, a blog crafted in his free time that turned into a fully-fledged currency website later sold to Finixio.


