|

AUD/USD recovery from down under runs into major resistance — Confluence Detector

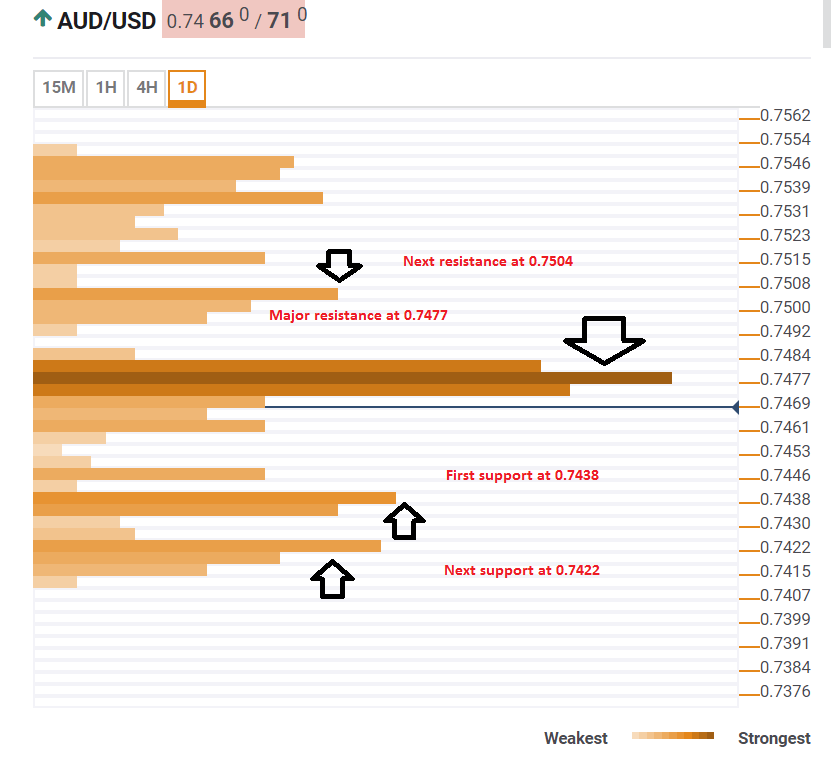
The AUD/USD reached the lowest levels in 11 months and began recovering as the US Dollar finally takes a breather. However, the pair may run into massive resistance. The Technical Confluences Indicator shows that the 0.7477 level is the convergence of the Simple Moving Average 200-15m, the SMA50-1h, the Fibonacci 38.2% one-day, the one-month low, the one-week low, and the Pivot Point one-week Support 1.

Should the Aussie break higher, the next cluster of resistance lines is not that far off. 0.7504 is the meeting point of the SMA100-1h, the Fibonacci 61.8% one-day, and the Fibonacci 23.6% one-week. 

On the downside, a congestion of support lines awaits at 0.7438 which is the 1d-high, the Bolinger Band 15m-Lower, and the Pivot Point one-month Support 1. The next cushion is at 0.7422 which is the confluence of the Pivot Point one-week Support 2 and the Bolinger Band one-hour Lower.

Here is how it looks on the tool:

AUD USD Technical confluence May 10 2018

Confluence Detector

The Confluence Detector finds exciting opportunities using Technical Confluences. The TC is a tool to locate and point out those price levels where there is a congestion of indicators, moving averages, Fibonacci levels, Pivot Points, etc. Knowing where these congestion points are located is very useful for the trader, and can be used as a basis for different strategies.

This tool assigns a certain amount of “weight” to each indicator, and this “weight” can influence adjacents price levels. This means that one price level without any indicator or moving average but under the influence of two “strongly weighted” levels accumulate more resistance than their neighbors. In these cases, the tool signals resistance in apparently empty areas.

Learn more about Technical Confluence

Author

Yohay Elam

Yohay Elam

FXStreet

Yohay is in Forex since 2008 when he founded Forex Crunch, a blog crafted in his free time that turned into a fully-fledged currency website later sold to Finixio.

More from Yohay Elam
Share:

Editor's Picks

EUR/USD flat lines around 1.1900; looks to US NFP report for fresh directional impetus

The EUR/USD pair is seen oscillating in a narrow trading band around the 1.1900 mark during the Asian session on Wednesday as traders opt to wait for the release of US monthly employment details before placing fresh directional bets.

GBP/USD recovers losses despite rising UK political risks, BoE rate cut bets

Pound Sterling advances against the US Dollar after registering modest losses in the previous session, trading around 1.3650 during the Asian hours on Wednesday. The pair could extend losses as the Pound Sterling faces pressure from rising political risks in the UK and growing expectations of near-term Bank of England rate cuts.

Gold sticks to gains near $5,050 amid Fed-driven USD weakness; focus remains on US NFP

Gold climbs back above the $5,050 level during the Asian session on Wednesday, reversing a part of the previous day's modest losses amid dovish US Federal Reserve-inspired US Dollar weakness. This, in turn, is seen as a key factor acting as a tailwind for the non-yielding yellow metal. 

Bitcoin, Ethereum and Ripple show no sign of recovery

Bitcoin, Ethereum, and Ripple show signs of cautious stabilization on Wednesday after failing to close above their key resistance levels earlier this week. BTC trades below $69,000, while ETH and XRP also encountered rejection near major resistance levels. With no immediate bullish catalyst, the top three cryptocurrencies continue to show no clear signs of a sustained recovery.

Dollar drops and stocks rally: The week of reckoning for US economic data

Following a sizeable move lower in US technology Stocks last week, we have witnessed a meaningful recovery unfold. The USD Index is in a concerning position; the monthly price continues to hold the south channel support.

XRP holds $1.40 amid ETF inflows and stable derivatives market

Ripple trades under pressure, with immediate support at $1.40 holding at the time of writing on Tuesday. A recovery attempt from last week’s sell-off to $1.12 stalled at $1.54 on Friday, leading to limited price action between the current support and the resistance.