AUD/USD Price Forecast: Further volatility is not ruled out
- AUD/USD regained some balance following a breakdown of 0.6700.
- The Dollar faced renewed downside pressure following key job data.
- Australia’s GDP figures matched previous estimates in Q2.
The US Dollar (USD) reversed part of Tuesday’s gains on Wednesday, lending support to the risk-related assets and thus triggering a decent rebound in AUD/USD, which regained the 0.6750 zone following a brief drop to the sub-0.6700 region.
That said, the pair receded to two-week lows near 0.6680, just to regain composure afterwards following the U-turn in the Greenback and weaker yields worldwide.
In the meantime, the Australian Dollar maintained its constructive outlook, which remains underpinned by the critical 200-day SMA at 0.6615. This positive view on the Australian currency appeared jeopardized by the recent move higher in the US Dollar as well as persistent concerns surrounding China’s economic outlook.
The daily rebound in the pair was also accompanied by a slight decline in both copper prices, while iron ore future prices remained within a consolidative theme just above $90. The bearishness surrounding iron ore prices is likely to cap further gains in the AUD, while it is expected to keep lingering amidst the persistently weak economic activity in China.
Recent shifts in monetary policy have also supported the Australian dollar's upward trend over recent weeks. The Reserve Bank of Australia (RBA) recently opted to hold the Official Cash Rate (OCR) steady at 4.35%, adopting a cautious approach amid ongoing domestic inflationary pressures, with no clear indication of easing policy soon.
In a subsequent speech, Governor Michelle Bullock reaffirmed that the RBA is prepared to raise rates further if necessary to control inflation, maintaining a hawkish stance due to persistently high underlying inflation. She emphasized that the central bank remains vigilant about inflation risks even after deciding to keep rates unchanged.
Further optimism around the AUD was bolstered by the hawkish tone in the latest RBA Minutes, which revealed a debate among members about whether to raise the cash rate target. The minutes underscored persistent inflationary pressures and market expectations of possible rate cuts in late 2024.
Echoing the hawkish sentiment, RBA Deputy Governor Andrew Hauser noted earlier this week that there wasn't yet enough confidence that inflation in Australia was on a sustainable path back to target, indicating that rates would need to be kept steady for now.
However, a drop in the Melbourne Institute inflation gauge to a three-year low of 2.5% year-on-year in August suggests the possibility of a lower RBA cash rate by the end of the year.
The RBA is anticipated to be the last among G10 central banks to start cutting rates.
However, with potential rate cuts from the Fed in the near future and the RBA's likely prolonged period of restrictive policy, AUD/USD seems poised for further gains in the coming months.
Nevertheless, the Australian dollar’s gains could be constrained by the slow and gradual recovery of the Chinese economy. Deflation and inadequate stimulus are stalling China’s post-pandemic recovery. The last Politburo meeting, while expressing support, failed to announce any substantial new stimulus measures, deepening concerns about demand from the world's second-largest economy.
Meanwhile, the latest CFTC report for the week ending August 27 indicated that speculators remained net short on the AUD, although their positions were halved compared to the previous week. The AUD has been in net-short territory since Q2 2021, with only a brief two-week exception earlier this year.
On the data front, in Australia, the GDP Growth Rate figures showed the economy expanded by 0.2% QoQ in Q2 and 1.0% YoY.
AUD/USD daily chart
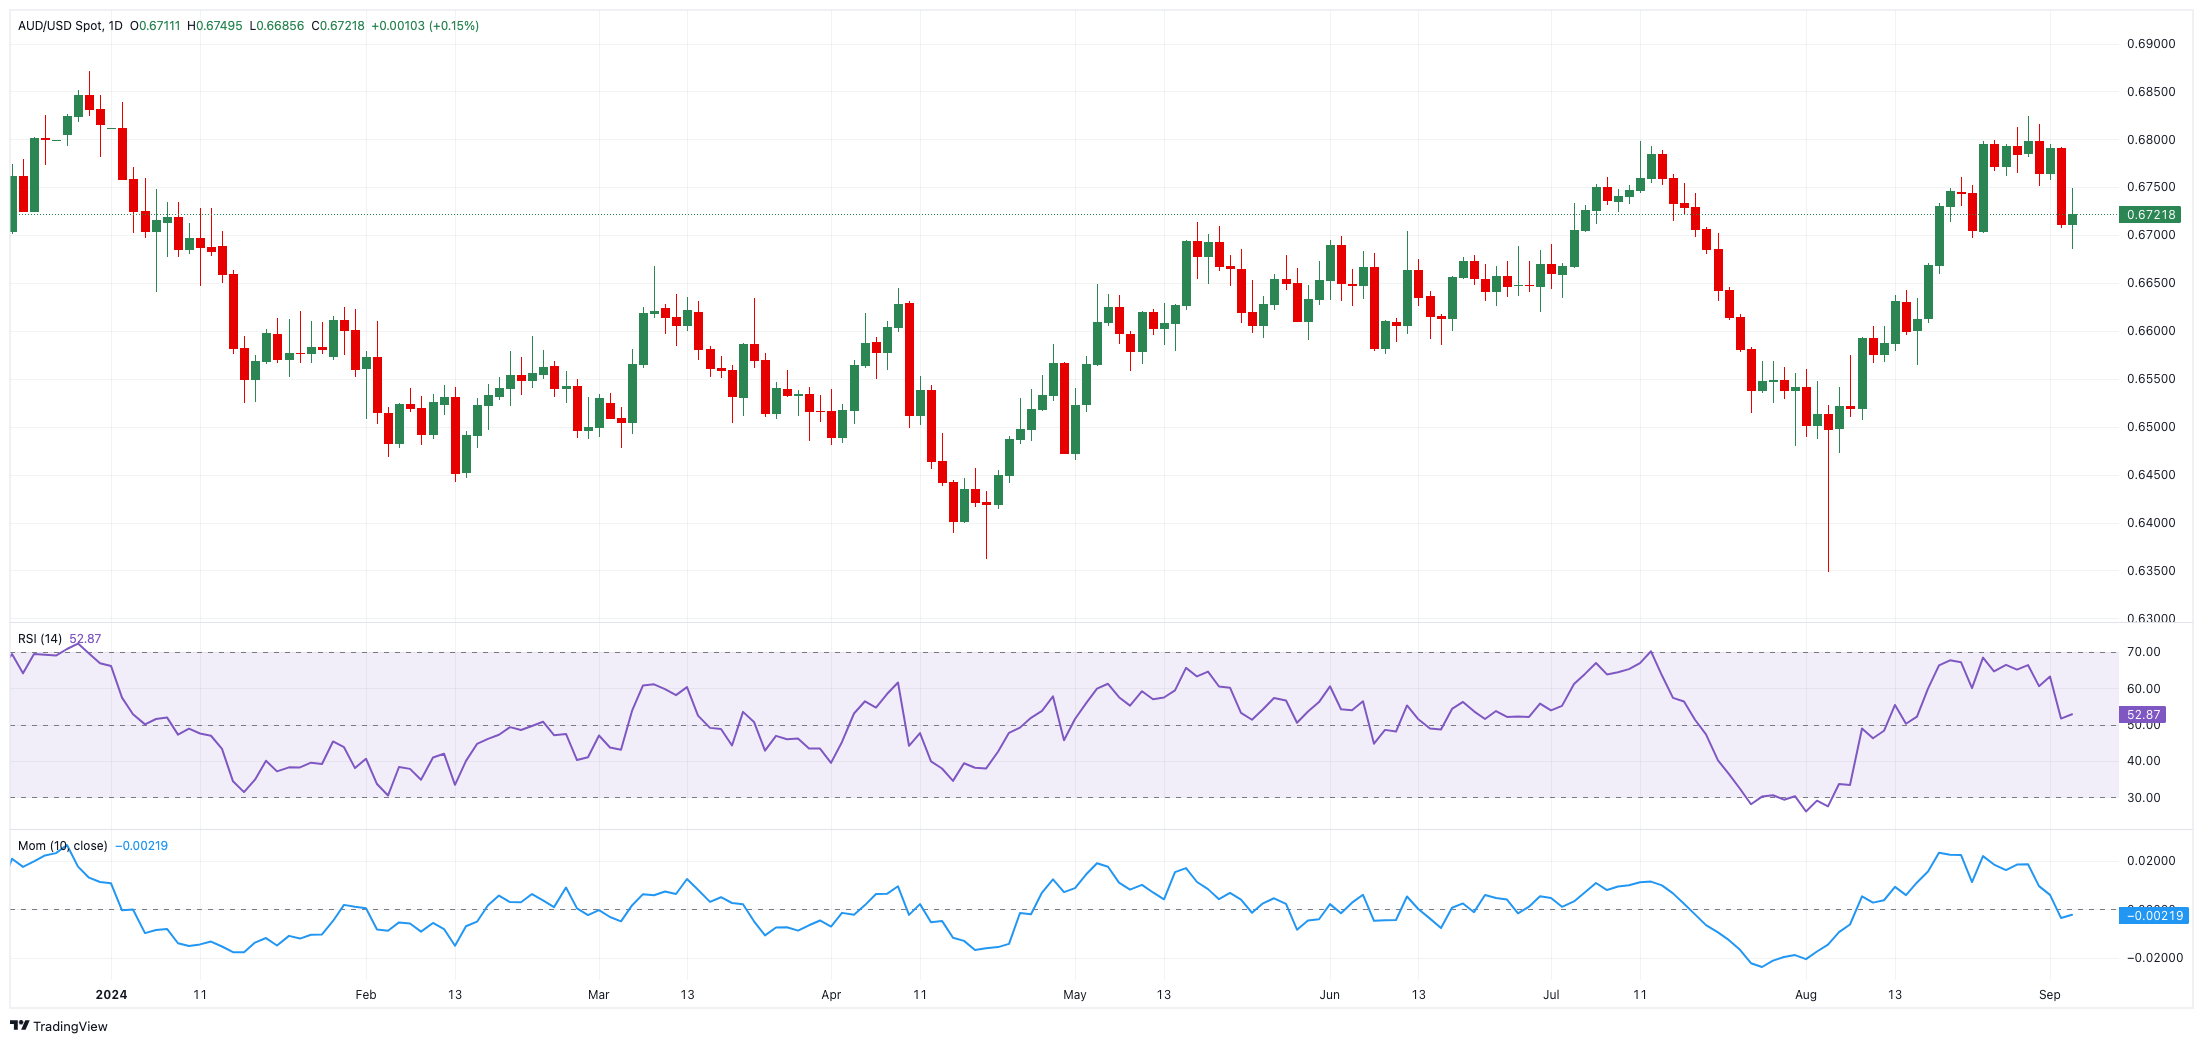
AUD/USD short-term technical outlook
Further increases are expected to push the AUD/USD to its August high of 0.6823 (August 29), followed by the December 2023 top of 0.6871 (December 28) and ultimately the 0.7000 level.
Bears, on the other side, may first pull the pair to the September low of 0.6685 (September 4) ahead of the temporary 55-day SMA of 0.6665, and the key 200-day SMA of 0.6615.
The four-hour chart sees a mild resumption of the upside bias. That said, the immediate resistance level is the 55-SMA at 0.6765, followed by 0.6823, which precedes 0.6871. On the other hand, the initial support level is 0.6685, followed by the 200-SMA at 0.664, and finally 0.6560. The RSI rose to nearly 42.
Premium
You have reached your limit of 3 free articles for this month.
Start your subscription and get access to all our original articles.
Author

Pablo Piovano
FXStreet
Born and bred in Argentina, Pablo has been carrying on with his passion for FX markets and trading since his first college years.


