AUD/USD Price Forecast: Another test of the November low is not ruled out
- AUD/USD added to Friday’s pullback and broke below 0.6600 once again.
- The “Trump trade” continued to underpin the move higher in the US Dollar.
- Chinese inflation figures lost further impulse in October.

The US Dollar added to Friday’s gains and kicked off the new trading week on a robust note, helped by the continuation of the so-dubbed “Trump trade”, lifting the US Dollar Index (DXY) to new four-month highs around 105.70.
In this environment, the Australian Dollar (AUD) remained well on the defensive, returning to the sub-0.6600 region and extending the trade below the critical 200-day SMA (0.6629), at the same time leaving the door open to extra losses in the short-term horizon.
Additionally, the Aussie Dollar derived extra downward pressure from further retracement in copper prices vs. marginal moves around iron ore price.
Also, on the negatives for AUD, weekend data from China revealed consumer prices rose at the slowest pace in four months in October, with deflationary pressures deepening on the producer side, underlining the country’s ongoing economic challenges.
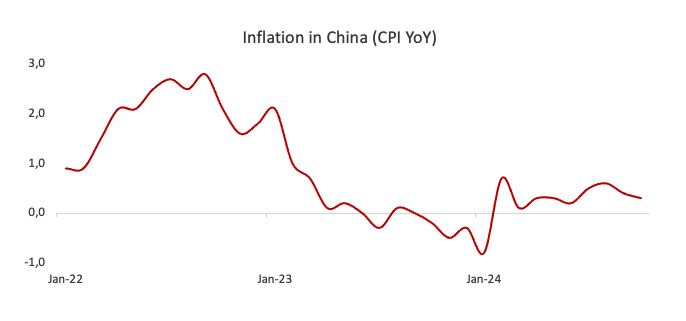
The above added to rising scepticism surrounding the implementation and ultimate effectiveness of the recently announced stimulus measures in China.
Back to monetary policy, the Reserve Bank of Australia (RBA) held rates steady at 4.35% at its meeting on November 5, as expected, while signalling a neutral stance on policy. The RBA noted inflation is gradually approaching its 2-3% target, though it lowered its growth forecast slightly.
Furthermore, RBA Governor Michele Bullock, in her subsequent press conference, struck a balanced tone, implying that the current interest rate level is appropriate for now. Markets anticipate a potential rate cut in May 2025, positioning the RBA as one of the last G10 central banks to consider easing.
Australia's latest inflation figures showed a cooling trend, with September's CPI slowing to 2.1% and the Q3 annual rate at 2.8%.
Looking ahead, while possible Federal Reserve (Fed) rate cuts may boost AUD/USD, the inflationary effects on the economy expected under a Trump administration should keep the Greenback well supported and hence limit the pair’s upside potential. In the same line persistent lingering concerns about China's economic outlook should keep AUD under the microscope.
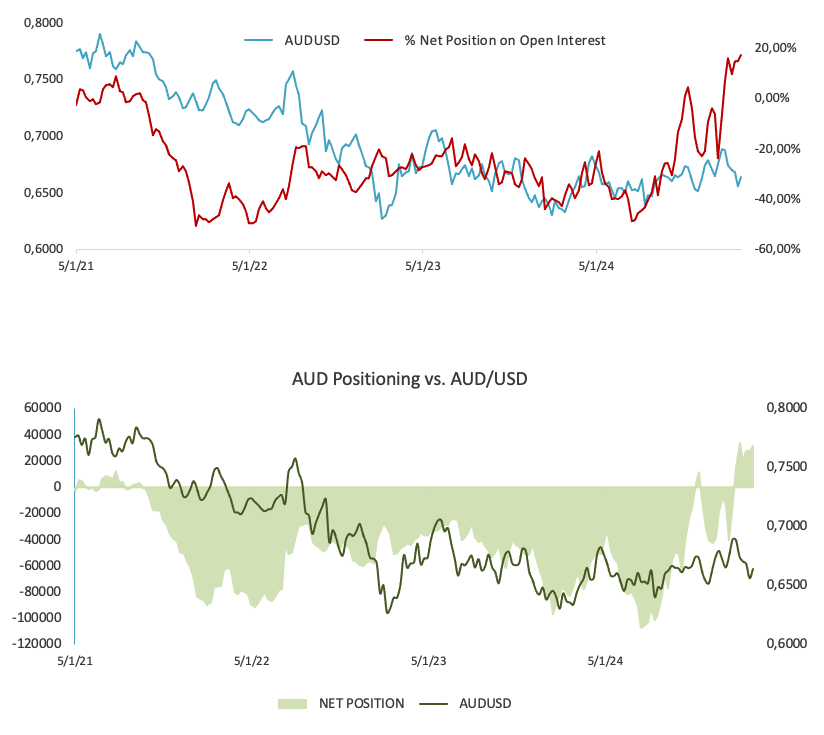
On another front, speculators remained net buyers of the Australian Dollar in the week to November 5, according to the latest CFTC report. The weekly move, however, came amidst the fourth consecutive pullback in open interest.
AUD/USD daily chart
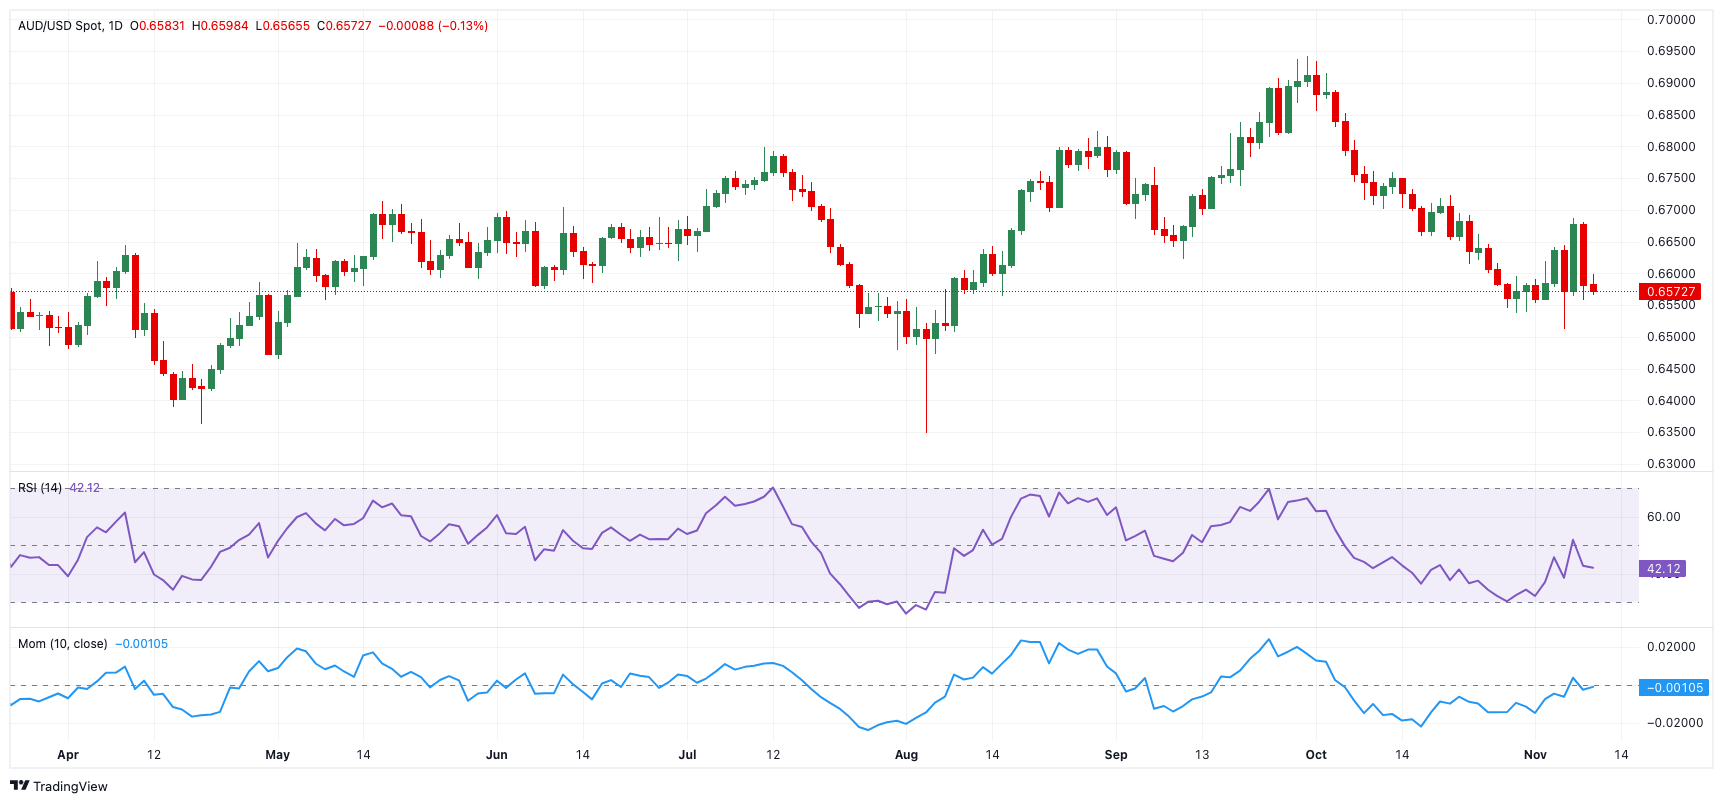
AUD/USD short-term technical outlook
On the upside, the AUD/USD should hit its initial resistance at the November peak of 0.6687 (November 7), an area reinforced by the provisional 100-day SMA. Further up emerges the interim 55-day SMA at 0.6720, before reaching the 2024 high of 0.6942 (September 30).
If sellers take control, the next point of contention is the November low of 0.6511 (November 6), which comes before the 2024 low of 0.6347 (August 5).
The four-hour chart shows a speedy return of the bearish trend. That being said, the initial support comes at 0.6558 prior to 0.6511. On the upside, immediate hurdle aligns at the 100-SMA at 0.6616 ahead of 0.6687. The RSI eased to around 42.
Premium
You have reached your limit of 3 free articles for this month.
Start your subscription and get access to all our original articles.
Author

Pablo Piovano
FXStreet
Born and bred in Argentina, Pablo has been carrying on with his passion for FX markets and trading since his first college years.


