AUD/USD Long-term Downtrend Continues After Completing WXY Correction

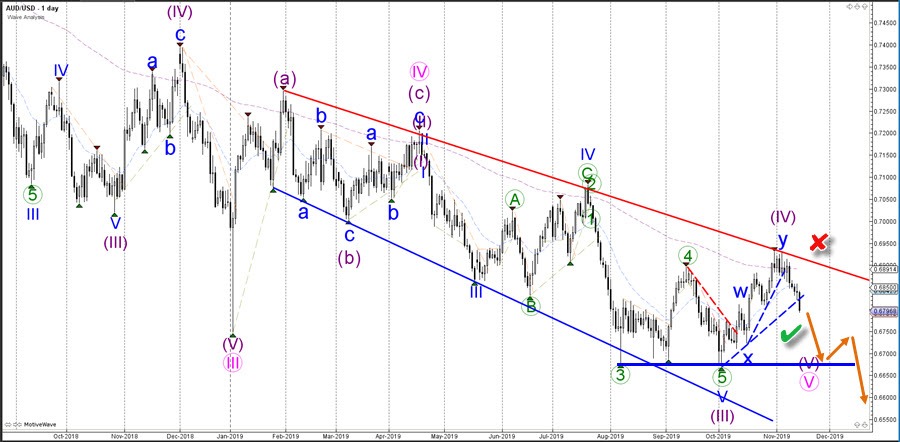
The AUD/USD is breaking the support trend lines (dotted blue), which could indicate the completion of the wave 4 (purple) and the start of a downtrend.
AUD/USD
Daily
The AUD/USD daily chart is in a long-term downtrend. Price has recently made a strong bearish bounce at the resistance trend line (red) after completing a complex WXY (blue) correction. The current bearish breakout (green check) is likely to test the previous bottom (blue) unless price breaks above the resistance (red) as this invalidates (red x) the current wave outlook.
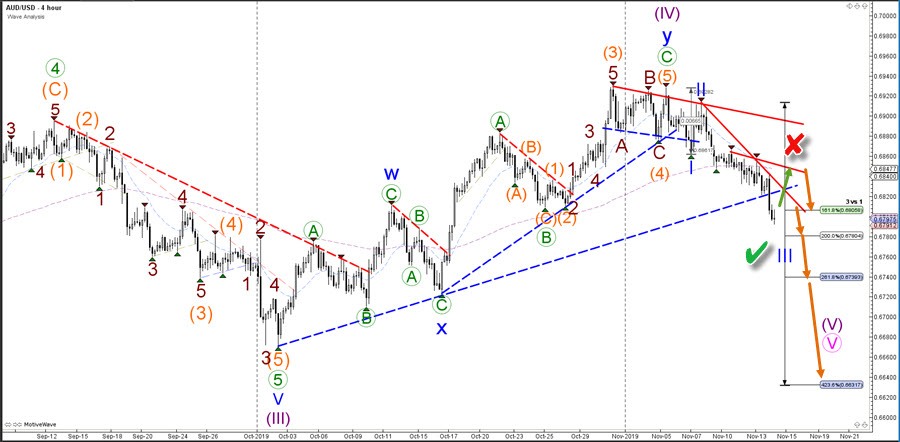
4 hour
The AUD/USD is bearish breakout looks like a wave 3 (blue) pattern as price is breaking below the 161.8% Fibonacci target. A bullish pullback (green arrow) could indicate the end of the wave 3 and the start of a wave 4 but a downtrend is expected to bounce at the previous resistance. A bearish continuation would confirm a wave 3 (blue) extension towards the Fib targets of wave 3 vs 1.
The analysis has been done with the CAMMACD.MTF template.
For more daily technical and wave analysis and updates, sign-up up to our ecs.LIVE channel.
Author

Chris Svorcik
Elite CurrenSea
Experience Chris Svorcik has co-founded Elite CurrenSea in 2014 together with Nenad Kerkez, aka Tarantula FX. Chris is a technical analyst, wave analyst, trader, writer, educator, webinar speaker, and seminar speaker of the financial markets.


