AUD/USD is at an interesting point to keep an eye at

AUD/USD has been bullish on the daily chart for the last few days. The chart produced three consecutive bullish candles. Yesterday’s candle closed right within a level of resistance, which is a triple top resistance. Thus, the pair is trading at an interesting level now. A bullish breakout may push the price towards the North, and a bearish breakout at the neckline may push the price towards the South. Major intraday charts and holiday factors may play a vital role in determining its next direction. Let us now dig into those equations.
Chart 1 AUD/USD Daily Chart
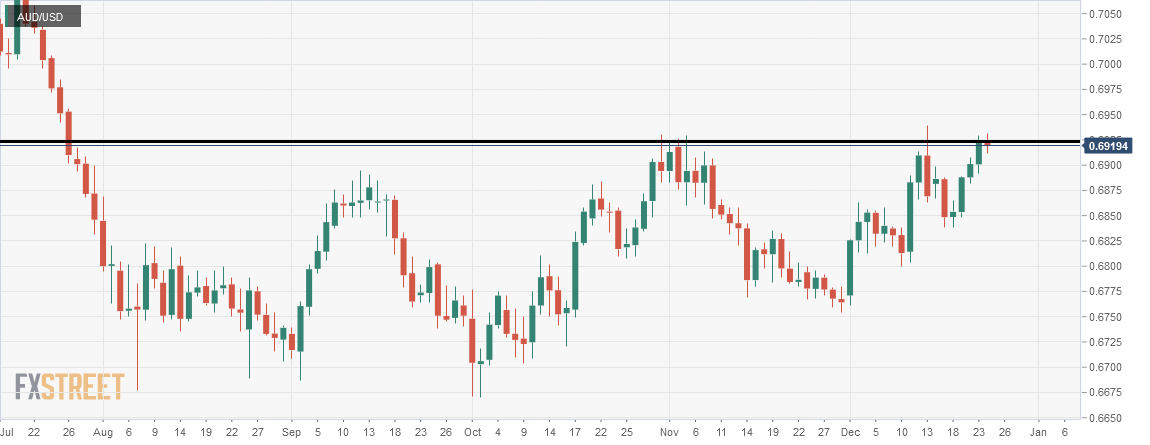
The chart shows that the price after being bullish had a rejection at the level of 0.6920. It headed towards the level again, and yesterday's bullish candle closed within the level again. If the price keeps moving towards the North, the daily traders may get themselves busy to look for long opportunities. On the other hand, if the daily chart produces a bearish reversal candle, they may wait for a breakout at the level of 0.6850 to go short.
Chart 1 AUD/USD Daily Chart
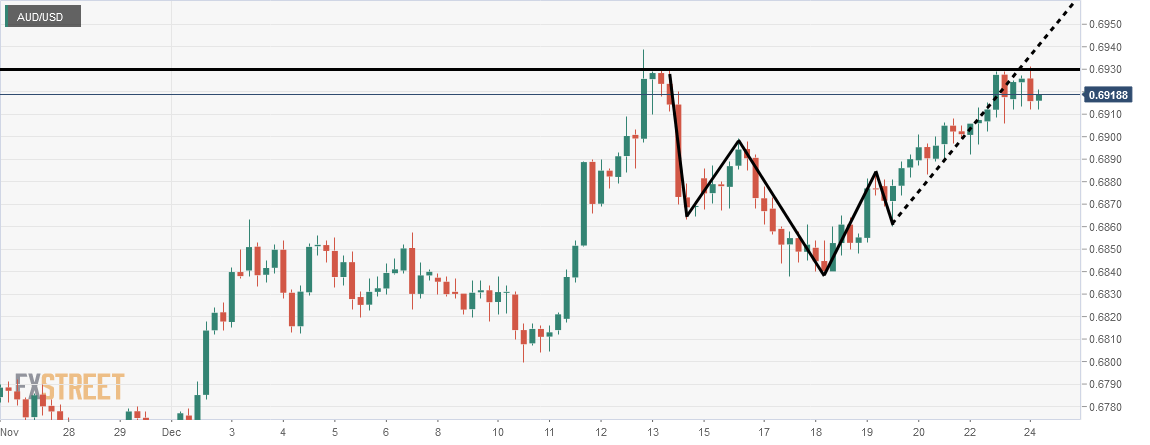
The H4 chart shows that the price has been trading by obeying an Inverted Head and Shoulder. It is now trading on the last arm. The price action suggests that the price may find its resistance here. The fact remains, if it makes a bullish breakout, the arm may be extended by making a new higher high. A strong bearish reversal candle, on the other hand, may push the price towards the level of 0.6840. To ride on that bearish wave, the H4 traders might as well wait for a daily bearish engulfing candle forming at the level of resistance.
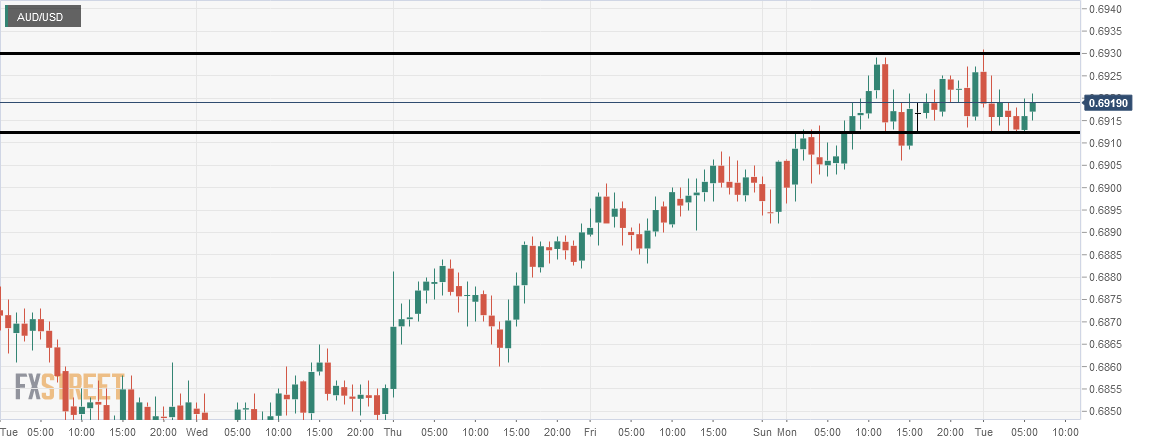
The H1 chart looks choppy. The price has been roaming around within those two levels for quite a few candles. If the price makes a bullish breakout at the level of 0.6930, the H1 buyers may go long by setting Stop Loss below the level of 0.6910. On the contrary, a bearish breakout at around the level of 0.6910 may make the traders go short by setting Stop Loss above the level of 0.6930. In both cases, the pair offers lucrative risk-reward.
All these three charts look interesting for the traders to keep an eye for trading opportunities. However, considering the factors such as the last week of 2019, Christmas, Boxing Day, thirty-first, and first January may hold the pair back from making a good move.
Author

EagleFX Team
EagleFX
EagleFX Team is an international group of market analysts with skills in fundamental and technical analysis, applying several methods to assess the state and likelihood of price movements on Forex, Commodities, Indices, Metals and


