|

AUD/USD in a range: Is a bullish breakout next?

  • AUD/USD extends sideways move within 0.6340-0.6448 area.

  • Key resistance levels in focus as bullish breakout still likely.

AUDUSD

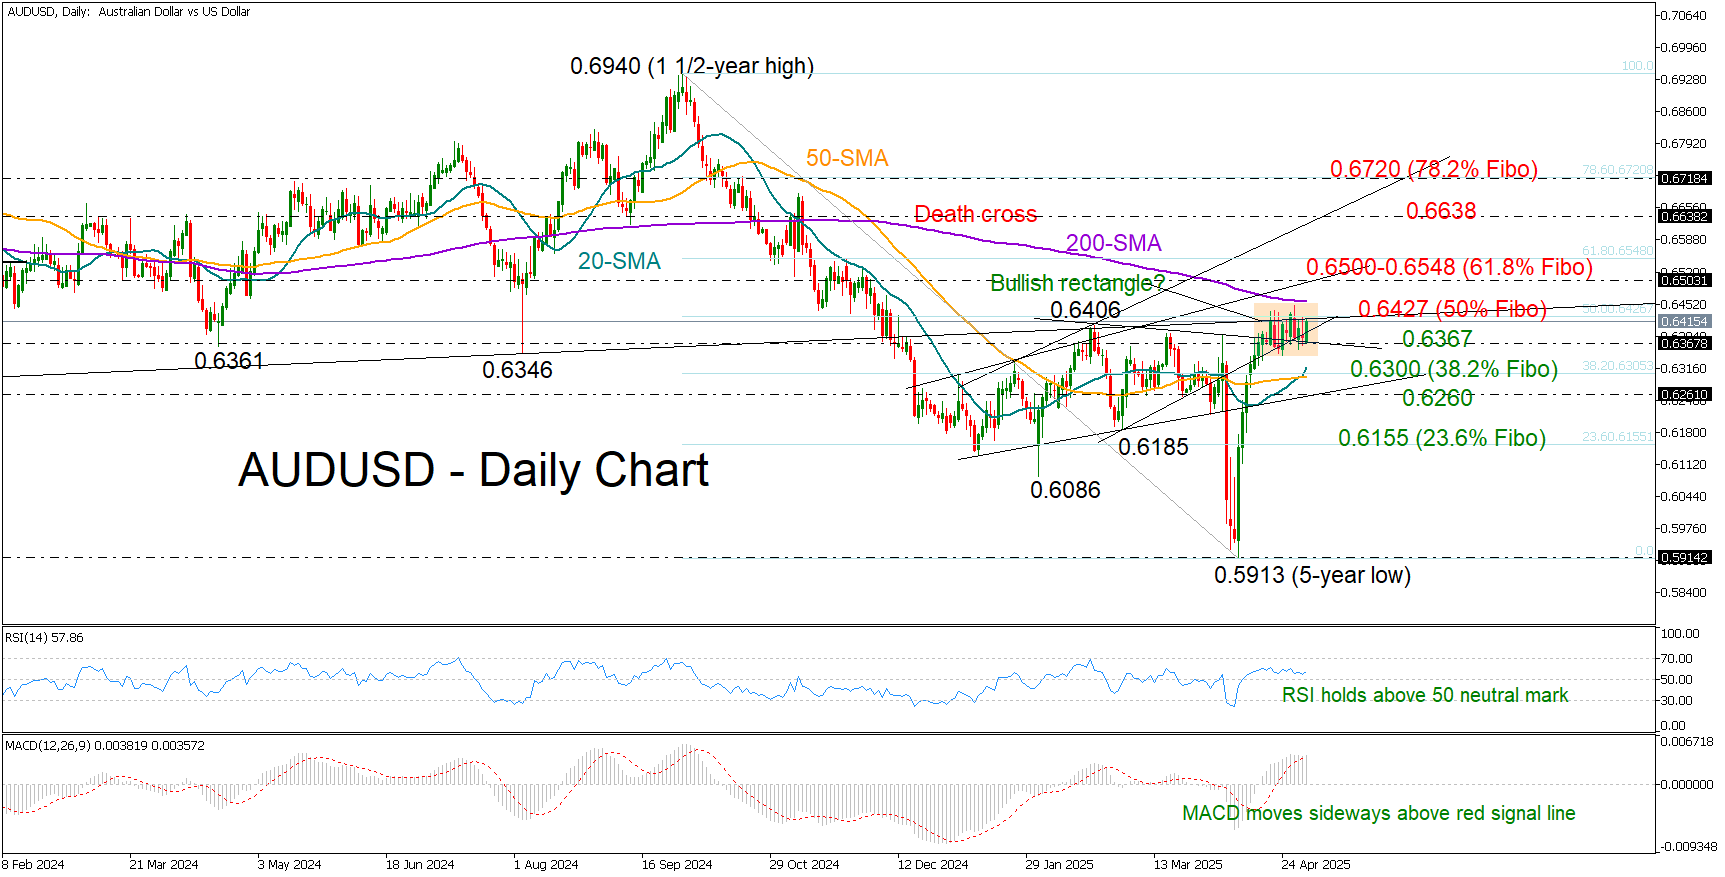
AUDUSD has been in a tight range for almost two weeks, consolidating its rapid rally from a five-year low below its 200-day simple moving average (SMA) and within the 0.6340-0.6448 area.

The 50% Fibonacci retracement of the September-April downtrend at 0.6427, along with the support-turned-resistance trendline from October 2023, has also posed a challenge for the bulls. However, with the RSI and the MACD fluctuating in the bullish area despite their sideways trajectory, hopes for an upward breakout remain alive ahead of the all-important US nonfarm payrolls. Additionally, the short-term sideways movement could be a bullish rectangle pattern, which typically resolves to the upside.

A move above the 200-day SMA at 0.6457 could initially stall somewhere between the 0.6500 psychological level and the 61.8% Fibonacci mark of 0.6548. A decisive break above the latter could trigger significant momentum toward the 0.6638 barrier, and potentially further to the 78.6% Fibonacci level at 0.6720.

In the bearish scenario, where the pair closes below 0.6367, the 20- and 50-day SMAs may help limit downside pressures near the 38.2% Fibonacci of 0.6300. Further congestion could occur around the 0.6260 area before a sharper decline toward the 23.6% Fibonacci level at 0.6155.

In a nutshell, although AUDUSD is maintaining a neutral short-term outlook, the technical indicators suggest that buyers remain active, likely awaiting a close above 0.6427 to regain control.

Author

Christina Parthenidou

Christina joined the XM investment research department in May 2017. She holds a master degree in Economics and Business from the Erasmus University Rotterdam with a specialization in International economics.

More from Christina Parthenidou
Share:

Editor's Picks

EUR/USD flat lines around 1.1900; looks to US NFP report for fresh directional impetus

The EUR/USD pair is seen oscillating in a narrow trading band around the 1.1900 mark during the Asian session on Wednesday as traders opt to wait for the release of US monthly employment details before placing fresh directional bets.

GBP/USD slips back to daily lows near 1.3640

GBP/USD drops to daily lows near 1.3640 as sellers push harder and the Greenback extends its rebound in the latter part of Tuesday’s session. Looking ahead, the combination of key US releases, including NFP and CPI, alongside important UK data, should keep the pound firmly in focus over the coming days.

Gold recovers to $5,050, focus shifts to US jobs data

Gold turns higher to test $5,050 in the Asian session on Wednesday. Traders assess whether Gold has found a floor following a historic sell-off. The delayed US employment report for January, which was pushed back due to the recently ended four-day government shutdown, will take center stage later on Wednesday.

Ethereum: Whales buy the dip amid rising short bets

Following one of Ethereum's largest weekly drawdowns, whales are slowly returning to action alongside a drop in retail selling pressure. After slightly selling into the decline at the start of the month, whales or wallets with a balance of 10K-100K ETH began buying the dip last Wednesday as prices crashed further. 

Dollar drops and stocks rally: The week of reckoning for US economic data

Following a sizeable move lower in US technology Stocks last week, we have witnessed a meaningful recovery unfold. The USD Index is in a concerning position; the monthly price continues to hold the south channel support.

XRP holds $1.40 amid ETF inflows and stable derivatives market

Ripple trades under pressure, with immediate support at $1.40 holding at the time of writing on Tuesday. A recovery attempt from last week’s sell-off to $1.12 stalled at $1.54 on Friday, leading to limited price action between the current support and the resistance.