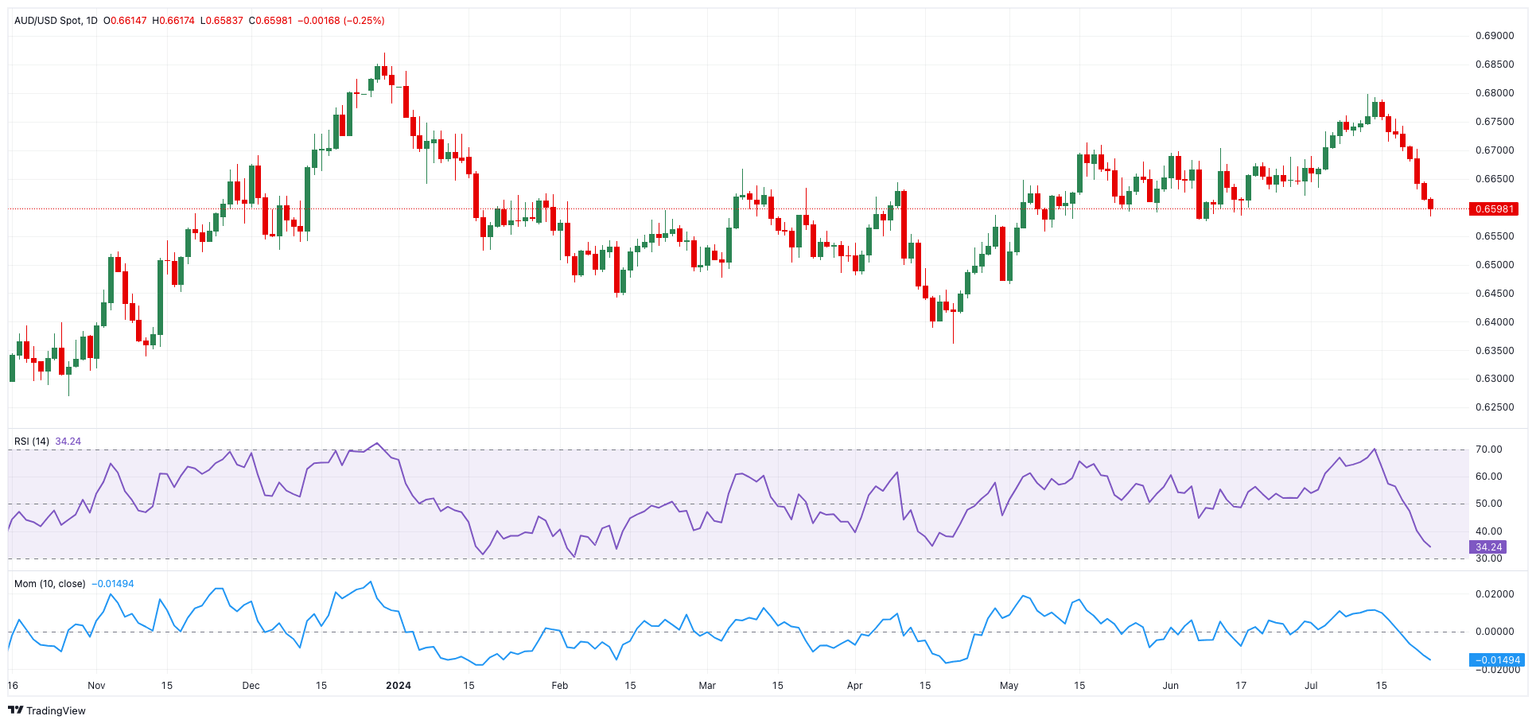
- AUD/USD accelerated its decline below 0.6600.
- Chinese concerns and weak commodities took a toll on AUD.
- Extra losses appear on the cards below the 200-day SMA.
AUD/USD extended its pronounced multi-day retracement, breaking below the 0.6600 level and flirting with the critical 200-day SMA in the vicinity of 0.6580 on Wednesday.
So far, AUD/USD has fully reversed its monthly rally, always on the back of poor economic prospects from China, falling commodity prices, occasional strength in the US Dollar (USD), and the recent interest rate cut by the People’s Bank of China (PBoC).
On the latter, the PBoC's unexpected decision to lower both short- and long-term interest rates earlier in the week negatively impacted the Chinese yuan, which in turn affected the Australian dollar due to Australia’s economic dependence on the Chinese market and the AUD’s role as a liquid proxy for the yuan.
Furthermore, incessant weakness in both copper and iron ore prices also contributed to the AUD’s sell-off, reflecting a broader decline in the commodity sector.
Regarding monetary policy, the Reserve Bank of Australia (RBA) is likely to be the last G10 central bank to start cutting interest rates.
In its latest meeting, the RBA maintained a hawkish stance, keeping the official cash rate at 4.35% and indicating flexibility for future decisions. Meeting minutes revealed that officials considered another rate hike to curb inflation but decided against it, partly due to concerns about a potential sharp slowdown in the labour market.
The RBA is in no rush to ease policy, anticipating that it will take time for inflation to consistently fall within the 2-3% target range.
Potential easing by the Federal Reserve (Fed) in the medium term, contrasted with the RBA’s likely prolonged restrictive stance, could support AUD/USD in the coming months. However, slow momentum in the Chinese economy might hinder a sustained recovery of the Aussie dollar as China continues to face post-pandemic challenges, deflation, and insufficient stimulus to spur a convincing recovery.
On the data front, July’s preliminary prints saw the Manufacturing PMI improve a tad to 47.4, and the Services PMI ease to 50.8, according to Judo Bank.
AUD/USD daily chart
AUD/USD short-term technical outlook
Further losses in the AUD/USD might find first support at the July low of 0.6583 (July 24), which coincides with the significant 200-day SMA. Down from here comes the June low of 0.6574 (June 10) seconded by the May low of 0.6465, and the 2024 bottom of 0.6362 (April 19).
Occasional bullish advances, on the other hand, should encounter an early resistance at the intermediate 55-day SMA of 0.6663, prior to the July peak of 0.6798 (July 8) and the December 2023 high of 0.6871.
Overall, the uptrend should continue as long as the AUD/USD trades above the 200-day SMA.
The 4-hour chart reveals a significant increase in the negative bias. Against this, immediate support develops at 0.6583, ahead of 0.6574. On the plus side, the first barrier is the 200-SMA of 0.6676, followed by 0.6754 and, finally, 0.6798. The RSI bounced to about 26.
Information on these pages contains forward-looking statements that involve risks and uncertainties. Markets and instruments profiled on this page are for informational purposes only and should not in any way come across as a recommendation to buy or sell in these assets. You should do your own thorough research before making any investment decisions. FXStreet does not in any way guarantee that this information is free from mistakes, errors, or material misstatements. It also does not guarantee that this information is of a timely nature. Investing in Open Markets involves a great deal of risk, including the loss of all or a portion of your investment, as well as emotional distress. All risks, losses and costs associated with investing, including total loss of principal, are your responsibility. The views and opinions expressed in this article are those of the authors and do not necessarily reflect the official policy or position of FXStreet nor its advertisers. The author will not be held responsible for information that is found at the end of links posted on this page.
If not otherwise explicitly mentioned in the body of the article, at the time of writing, the author has no position in any stock mentioned in this article and no business relationship with any company mentioned. The author has not received compensation for writing this article, other than from FXStreet.
FXStreet and the author do not provide personalized recommendations. The author makes no representations as to the accuracy, completeness, or suitability of this information. FXStreet and the author will not be liable for any errors, omissions or any losses, injuries or damages arising from this information and its display or use. Errors and omissions excepted.
The author and FXStreet are not registered investment advisors and nothing in this article is intended to be investment advice.
Recommended Content
Editors’ Picks

EUR/USD retreats from fresh multi-year highs, holds above 1.1000
EUR/USD neared 1.1150 in the European session on Thursday, shedding roughly 100 pips afterwards. The Euro holds on to solid gains amid broad US Dollar weakness, after US President Trump unveiled aggressive tariffs on the "Liberation Day." Markets await mid-tier US data releases.

GBP/USD surges to multi-month tops near 1.3200 ahead of US data
GBP/USD paused its rally after briefly surpassing the 1.3200 mark, yet holds on to most of its intraday gains. The US Dollar plunged to a fresh YTD low amid worries about a tariff-driven US economic slowdown, lifting Fed rate cut bets and weighing on the Greenback. The focus now remains on the US data for further impetus.

Gold retreats below $3,100 from all-time peak
Gold price extends its steady intraday pullback from the all-time peak touched this Thursday, and pierces the $3,100 mark in the European session. Bullish traders opt to take some profits off the table and lighten their bets around the commodity amid slightly overbought conditions.

SOL is the winner as Solana chain turns into battleground for meme coin launchpad and DEX
Solana (SOL) gains nearly 2% in the last 24 hours and trades at 118.28 at the time of writing on Thursday. A Decentralized Exchange (DEX) and a meme coin launchpad built on the Solana blockchain have waged a war for users and compete for the trade volume on the chain.

Trump’s “Liberation Day” tariffs on the way
United States (US) President Donald Trump’s self-styled “Liberation Day” has finally arrived. After four straight failures to kick off Donald Trump’s “day one” tariffs that were supposed to be implemented when President Trump assumed office 72 days ago, Trump’s team is slated to finally unveil a sweeping, lopsided package of “reciprocal” tariffs.

The Best brokers to trade EUR/USD
SPONSORED Discover the top brokers for trading EUR/USD in 2025. Our list features brokers with competitive spreads, fast execution, and powerful platforms. Whether you're a beginner or an expert, find the right partner to navigate the dynamic Forex market.