AUD/USD Forecast: A deeper decline likely below 0.6700
- The Aussie dollar succumbs to extra strength in the greenback.
- AUD is expected to closely follow results in China on Thursday.
- Downside pressure in AUD/USD retargets the 200-day SMA.

The continuation of the sharp bounce in the greenback motivated AUD/USD to shed further ground and end its fourth consecutive session of losses on Wednesday, this time briefly flirting with the 0.6700 neighbourhood before bouncing a tad towards the end of the NA session.
Despite further easing of the US labour market, as per JOLTs readings for the month of November, the greenback remained well bid on the back of higher yields, a firmer-than-expected ISM Manufacturing PMI and some hawkish-ish comments from Richmond Fed T. Barkin, who insisted on leave potential rate hikes on the table for the time being.
Absent data releases Down Under on Thursday, investors' attention is expected to remain on the publication of the Chinese Caixin Services PMI and Composite PMI for the month of December, all following the improvement in the manufacturing gauge seen earlier in the week.
So far, dynamics around the Federal Reserve and the likelihood of interest rate cuts as soon as in Q2 (March remains a feasible candidate) as well as the stagnant recovery (if any at all) of the Chinese economy in the post-pandemic era should be key drivers for the Aussie dollar in the weeks to come, all against the backdrop of a so far pause in the RBA.
Further stuff for AUD to look at on Thursday comes from the US docket and the measure of job creation by the private sector tracked by the ADP report as well as the usual weekly Initial Jobless Claims for the week to December 23.
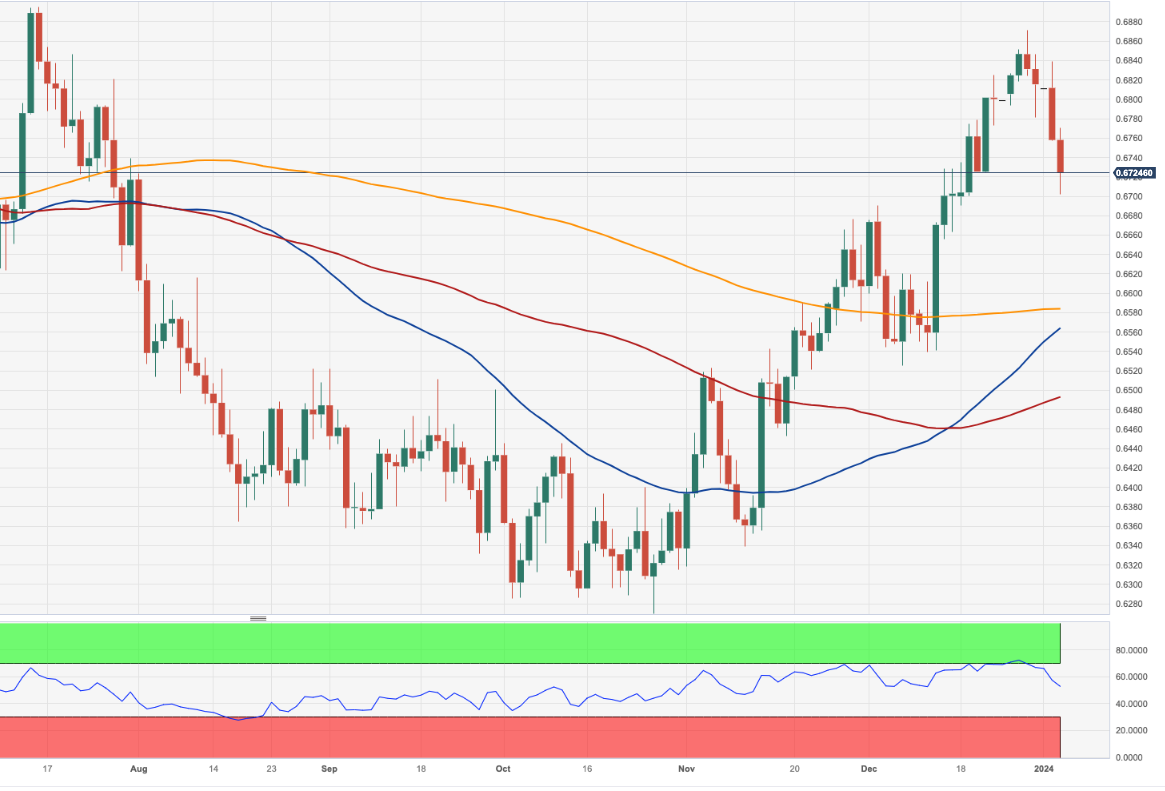
AUD/USD short-term technical outlook
In case bulls regain the upper hand, AUD/USD is expected to shift its focus to the 0.6900 region, where coincide the June and July tops. Once the pair clears this area, the next hurdle to keep an eye on will be the psychological 0.7000 mark. Further weakness, on the flip side, should leave behind the 0.6700 support to put a potential visit to the key 200-day SMA at 0.6582 back on the radar. The loss of this region should meet a transitory contention at the 55-day SMA at 0.6554 prior to the December 2023 low of 0.6525 (December 7).
A glimpse at the 4-hour chart highlights the key contention area around 0.6700. Once breached, spot could revisit the 0.6663 level ahead of another solid support region at the 200-SMA near 0.6650. The MACD remains deep in the red zone while the RSI navigates the proximity of the oversold territory. The resumption of the bullish trend should meet an initial barrier at the 55-SMA at 0.6794, which is deemed as the last defence prior to recent peaks around 0.6870.
Premium
You have reached your limit of 3 free articles for this month.
Start your subscription and get access to all our original articles.
Author

Pablo Piovano
FXStreet
Born and bred in Argentina, Pablo has been carrying on with his passion for FX markets and trading since his first college years.


