AUD/USD Elliott Wave technical analysis [Video]
![AUD/USD Elliott Wave technical analysis [Video]](https://editorial.fxsstatic.com/images/i/AUDUSD_XtraLarge.png)
AUD/USD Elliott Wave technical analysis – Daily chart
-
Function: Trend.
-
Mode: Impulsive.
-
Structure: Orange Wave 3.
-
Position: Navy Blue Wave 1.
-
Direction next higher degrees: Orange Wave 3 (Active).
-
Details: Orange Wave 2 seems completed, and Orange Wave 3 is underway.
-
Wave cancel invalid level: 0.63734.
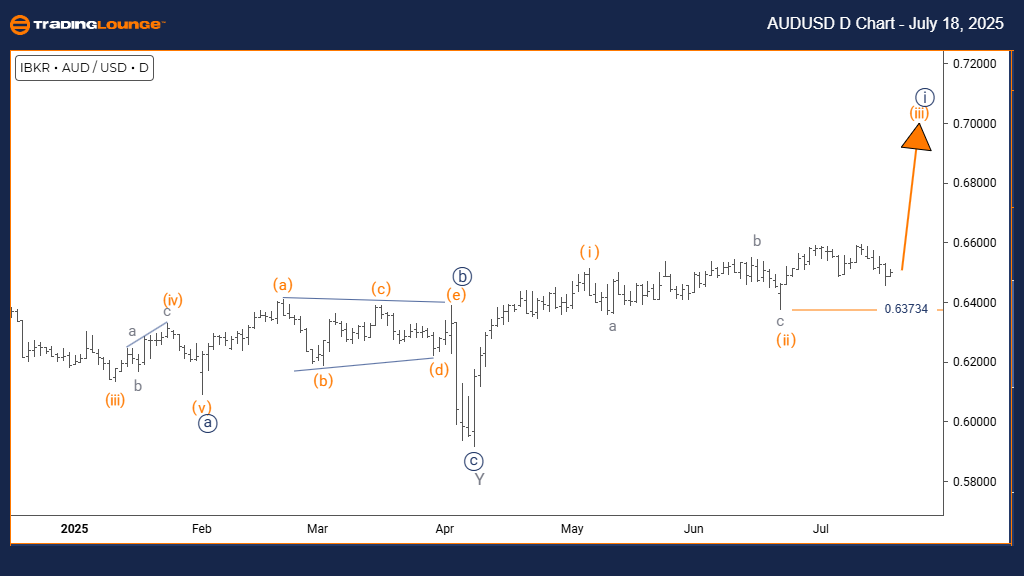
The daily Elliott Wave analysis for AUDUSD shows a strong upward trend, driven by clear impulsive price movements. The chart highlights the development of Orange Wave 3 inside a broader Navy Blue Wave 1, suggesting the currency pair has entered one of the most active stages of an Elliott Wave pattern. With Orange Wave 2 now complete, price action has moved into Orange Wave 3, often known for delivering the most significant gains in bullish trends.
The impulsive structure reflects continued upward momentum, with price printing higher highs and strong volume activity, which typically signals institutional buying. Positioned within Navy Blue Wave 1, Orange Wave 3 may set the foundation for a larger upward structure. The wave invalidation level is at 0.63734, acting as a vital marker for maintaining the current bullish scenario.
This chart analysis shows that the pair has likely exited its corrective stage and entered a new impulsive move, offering traders the possibility of catching strong price action. The transition from Wave 2 to Wave 3 is often a key moment where upward moves become more aggressive and sustained.
Traders should observe the development of Orange Wave 3 for confirmation of ongoing momentum. The 0.63734 level serves as a key stop-loss benchmark to ensure the structure holds. The outlook remains positive with the trend expected to continue, providing attractive opportunities during this wave phase.
AUD/USD Elliott Wave technical analysis – Four-hour chart
-
Function: Trend.
-
Mode: Impulsive.
-
Structure: Gray Wave 3.
-
Position: Orange Wave 3.
-
Direction next higher degrees: Gray Wave 3 (Active).
-
Details: Gray Wave 2 seems completed, and Gray Wave 3 is in progress.
-
Wave cancel invalid level: 0.63734.
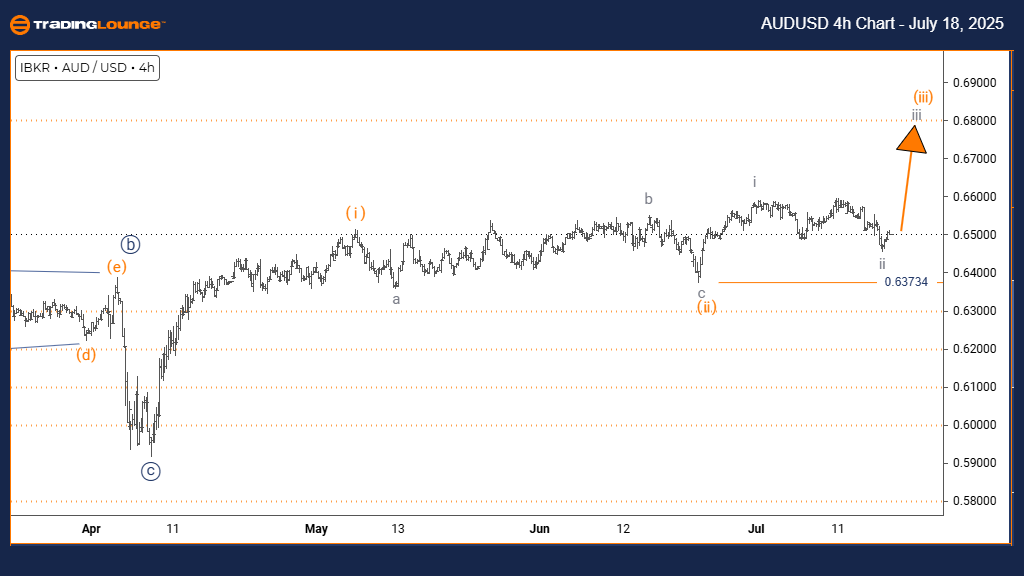
The 4-hour chart of AUDUSD presents a strong trending setup, with impulsive behavior indicating significant upward momentum. Gray Wave 3 is forming within the broader Orange Wave 3, suggesting the market is deep into a powerful Elliott Wave phase. Technical signals show that Gray Wave 2 has finished, and now Gray Wave 3 is in motion—a phase often marked by sharp and continuous gains.
The pattern exhibits strong directional movement, with a series of higher highs, consistent with increasing demand. With this wave nested inside Orange Wave 3, the pair is currently in one of the strongest stages of the trend. The wave cancel level of 0.63734 defines a key technical threshold that, if broken, would invalidate the bullish outlook.
The setup confirms that AUDUSD has moved from correction into a full uptrend phase, with further upside potential likely as Gray Wave 3 develops. Traders can interpret this phase as the most favorable in terms of risk-to-reward. Momentum remains strong, and the market structure supports continued bullish sentiment.
Monitoring this impulsive wave phase is essential, and traders should use the invalidation level to protect their strategies. The outlook remains positive with strong potential for extended gains, especially as the wave unfolds further in line with classic Elliott Wave theory.
AUD/USD Elliott Wave technical analysis [Video]
Author

Peter Mathers
TradingLounge
Peter Mathers started actively trading in 1982. He began his career at Hoei and Shoin, a Japanese futures trading company.


