AUD/USD Elliott Wave technical analysis [Video]
![AUD/USD Elliott Wave technical analysis [Video]](https://editorial.fxsstatic.com/images/i/AUDUSD-neutral-object_XtraLarge.png)
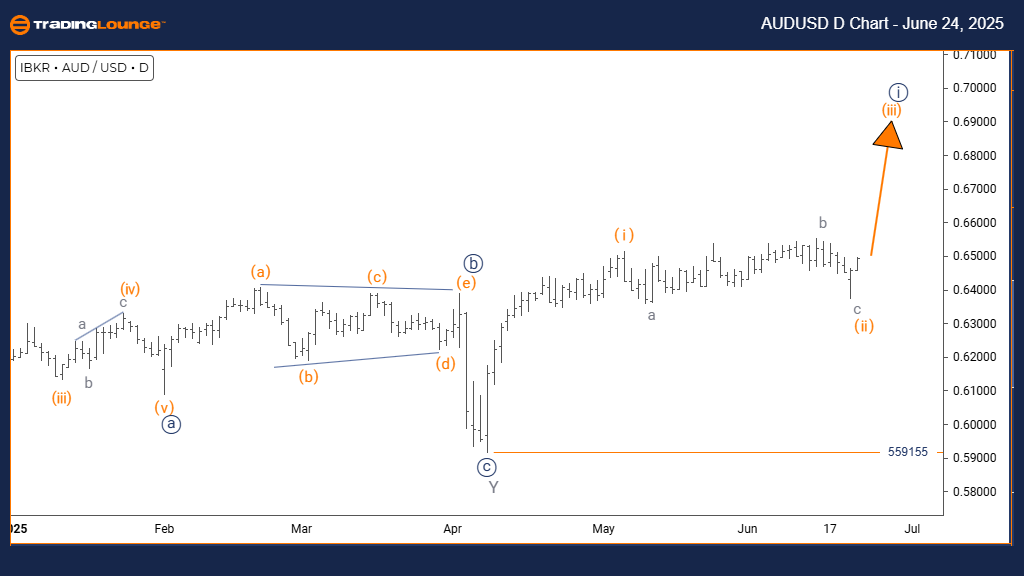
AUD/USD Elliott Wave technical analysis – Day chart
Function: Bullish Trend.
Mode: Impulsive.
Structure: Orange Wave 3.
Position: Navy Blue Wave 1.
Direction next lower degrees: Orange Wave 4.
Details: Orange Wave 2 looks completed. Now, Orange Wave 3 is developing.
Cancel invalid level: 0.559155.
The AUDUSD day chart shows a bullish trend. Price is currently in an impulsive phase, suggesting strong momentum. The wave structure identifies Orange Wave 3, which forms part of Navy Blue Wave 1 — a phase known for its rapid and forceful movements.
Orange Wave 2 has likely ended its correction, leading into Orange Wave 3 of Navy Blue Wave 1. This is often the most aggressive segment in an Elliott Wave cycle. A correction phase, Orange Wave 4, is expected after Wave 3 concludes.
A key level to watch is the invalidation point at 0.559155. A drop below this would nullify the current wave count and require a reevaluation. Until then, the bullish trend remains valid.
This setup indicates that AUDUSD could see substantial gains. The impulsive characteristics of Orange Wave 3 show strong institutional interest and support the continuation of the upward trend within the Navy Blue Wave 1 framework.
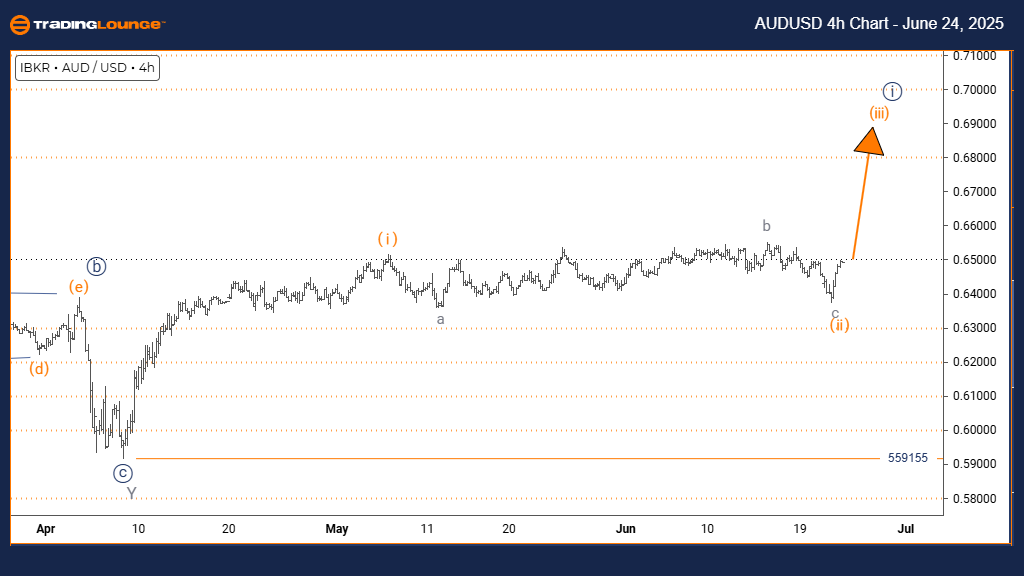
AUD/USD Elliott Wave technical analysis – Four-hour chart
Function: Bullish Trend.
Mode: Impulsive.
Structure: Orange Wave 3.
Position: Navy Blue Wave 1.
Direction next higher degrees: Orange Wave 3 (Started).
Details: Orange Wave 2 seems completed. Orange Wave 3 is now unfolding.
Wave cancel invalid level: 0.559155.
The 4-hour chart of AUDUSD supports a bullish trend with impulsive price action. The current structure — Orange Wave 3 — belongs to Navy Blue Wave 1. This stage reflects the most powerful section of an Elliott Wave cycle.
The completion of Orange Wave 2 led to the beginning of Orange Wave 3. As part of a first wave sequence, this segment often experiences strong upward price moves with limited pullbacks. The next key development will be tracking the continuation of Orange Wave 3.
The invalidation level is 0.559155. If price drops below it, the bullish wave count would be invalid. Until that happens, the upward structure remains in force.
Technically, AUDUSD shows potential for extended gains. Orange Wave 3 is typically robust, indicating increased buying pressure and a probable continuation of the trend under Navy Blue Wave 1.
AUD/USD Elliott Wave technical analysis [Video]
Author

Peter Mathers
TradingLounge
Peter Mathers started actively trading in 1982. He began his career at Hoei and Shoin, a Japanese futures trading company.


