AUD/USD Elliott Wave technical analysis [Video]
![AUD/USD Elliott Wave technical analysis [Video]](https://editorial.fxsstatic.com/images/i/AUDUSD-bullish-animal_XtraLarge.png)
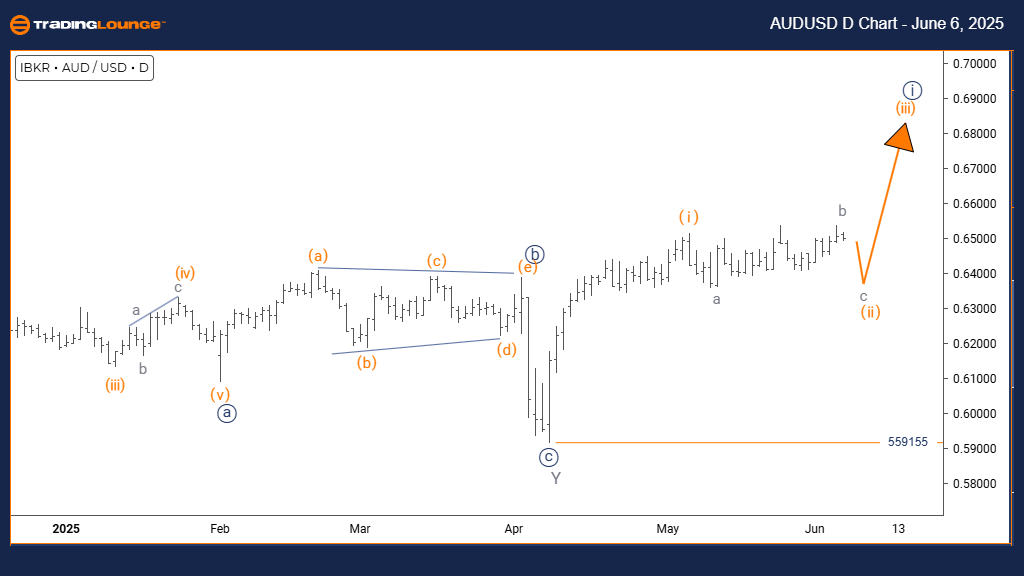
AUD/USD Elliott Wave technical analysis
Function: Counter-Trend.
Mode: Corrective.
Structure: Orange Wave 2.
Position: Navy Blue Wave 1.
Direction next higher degrees: Orange Wave 3.
Details: Orange wave 1 appears complete; orange wave 2 is underway.
Wave cancel invalid level: 0.559155.
The daily chart reveals AUDUSD in a counter-trend, corrective movement within a broader bearish framework. Technically, orange wave 2 is forming as part of a larger downward trend, indicated by navy blue wave 1. This suggests orange wave 1 has finished, and the pair is now in a temporary retracement.
This setup signals a brief pause in the main trend. As orange wave 1 ends, orange wave 2 begins a limited rebound. However, this is not expected to lead to a bullish reversal. Downside pressure remains favored, with a critical invalidation level marked at 0.559155. A move above this could indicate a more complex correction or a possible change in trend.
This analysis provides key context for traders watching AUDUSD’s position within its correction cycle. Current market structure suggests ongoing volatility as orange wave 2 progresses. Once wave 2 completes, wave 3’s downward movement is expected to begin. Traders should monitor for price patterns signaling the end of this corrective phase.
This framework outlines both the present counter-trend behavior and the likely return to a bearish path. Traders are advised to stay vigilant for technical signals and manage risk carefully due to the possibility of wave misinterpretation. The current move is likely part of a correction and not a fresh bullish trend, so downside continuation is expected after this rebound concludes.
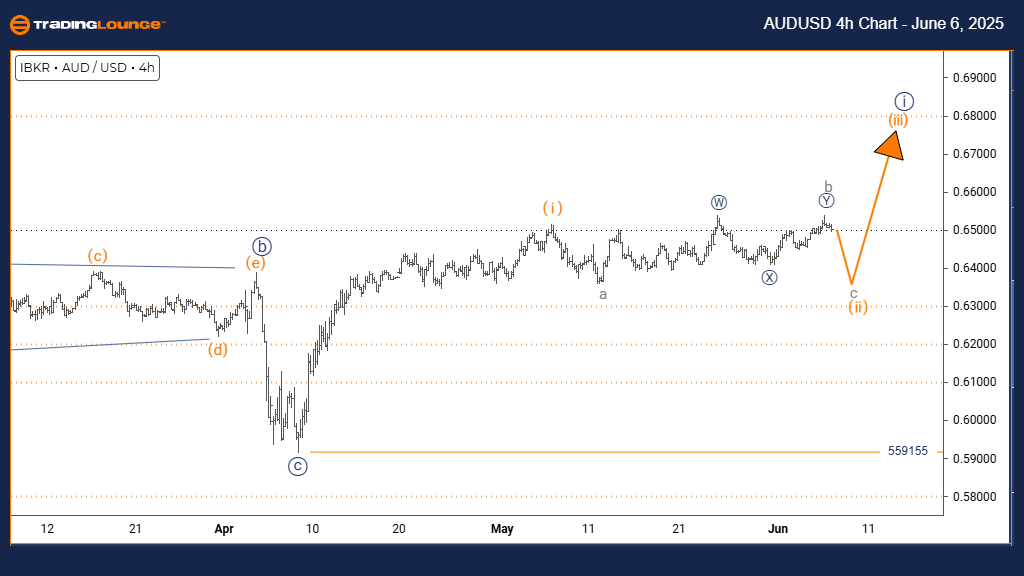
AUD/USD Elliott Wave technical analysis
Function: Counter-Trend.
Mode: Corrective.
Structure: Gray Wave C.
Position: Orange Wave 2.
Direction next higher degrees: Orange Wave 3.
Details: Gray wave B appears complete; gray wave C of 2 is currently developing.
Wave cancel invalid level: 0.559155.
The 4-hour chart analysis identifies AUDUSD in a counter-trend, corrective pattern. Gray wave C is taking shape within the broader structure, acting as the final leg of orange wave two. The upward retracement in gray wave B is complete, and the market is now declining in what appears to be the closing stage of this correction.
This indicates that gray wave B has ended and gray wave C has started moving downward. The corrective profile suggests the decline will stay within projected limits. The broader trend still leans bullish, forecasting a rise in orange wave three once the correction ends. A crucial invalidation level is set at 0.559155; crossing this could imply a more complex correction or even a trend shift.
This analysis delivers key context for forex traders regarding AUDUSD’s current place in its cycle. With gray wave C progressing, a limited downside is expected before the broader trend resumes upward. Traders should track market signals for wave C’s end, which would signal the beginning of orange wave three’s advance.
This outlook helps traders navigate the final corrective stages, highlighting potential reversal zones. Risk management remains essential, as the ongoing movement is part of a larger structure. The identified invalidation level acts as a critical checkpoint for evaluating trades during this transitional phase.
AUD/USD Elliott Wave technical analysis [Video]
Author

Peter Mathers
TradingLounge
Peter Mathers started actively trading in 1982. He began his career at Hoei and Shoin, a Japanese futures trading company.


