AUD/USD Elliott Wave technical analysis [Video]
![AUD/USD Elliott Wave technical analysis [Video]](https://editorial.fxstreet.com/images/Markets/Currencies/Majors/AUDUSD/macro-of-aussie-20-note-8668638_XtraLarge.jpg)
AUD/USD Elliott Wave technical analysis
-
Function: Trend.
-
Mode: Impulsive.
-
Structure: Navy Blue Wave 1.
-
Position: Gray Wave 3.
-
Direction next higher degrees: Navy Blue Wave 1 (Continue).
-
Details: Gray Wave 2 appears to be completed; currently, Navy Blue Wave 1 of 3 is in progress.
-
Wave cancel invalid level: 0.63489.
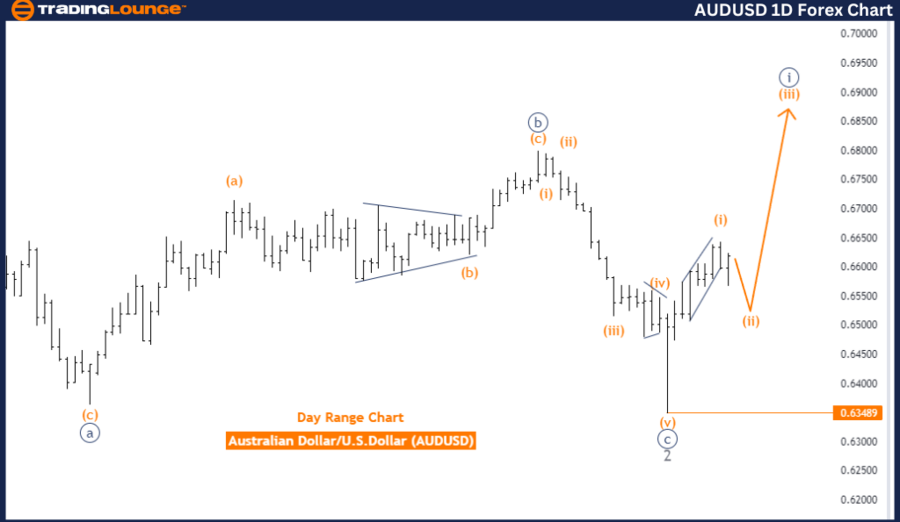
The AUDUSD daily chart is displaying a trend movement based on Elliott Wave analysis, currently in an impulsive mode. The structure under examination is identified as Navy Blue Wave 1, marking the initial phase of a more extensive impulsive wave. This phase is characterized by a strong directional movement, which aligns with the broader trend.
At present, the market is positioned in Gray Wave 3, part of the larger Navy Blue Wave 1 structure. The apparent completion of Gray Wave 2 indicates that the market has concluded its corrective phase and is now advancing with the impulsive wave of Navy Blue Wave 1. This pattern is consistent with Elliott Wave theory, where after a correction, the market typically resumes its trend direction with renewed momentum.
The direction of the next higher degrees remains consistent with Navy Blue Wave 1, suggesting that the market is expected to continue its current trend, progressing further within the impulsive wave structure. The conclusion of Gray Wave 2 and the beginning of Navy Blue Wave 1 of 3 suggest that the market is in the early stages of a potentially significant trend movement.
A critical level to watch is the wave cancel invalid level at 0.63489. Should the market breach this level, it would invalidate the current wave count, indicating a potential shift in the trend or a different wave structure than initially anticipated.
In conclusion, the AUDUSD daily chart is in an impulsive mode, with the market currently in Gray Wave 3 as part of Navy Blue Wave 1. The completion of Gray Wave 2 indicates the continuation of the trend, with Navy Blue Wave 1 of 3 now underway. The wave cancellation invalid level at 0.63489 is crucial for confirming the accuracy of this analysis.
AUD/USD day chart
AUD/USD Elliott Wave technical analysis
-
Function: Counter Trend.
-
Mode: Corrective.
-
Structure: Orange Wave 2.
-
Position: Navy Blue Wave 1.
-
Direction next higher degrees: Orange Wave 3.
-
Details: Orange Wave 1 appears completed; currently, Orange Wave 2 is in play.
-
Wave cancel invalid level: 0.63489
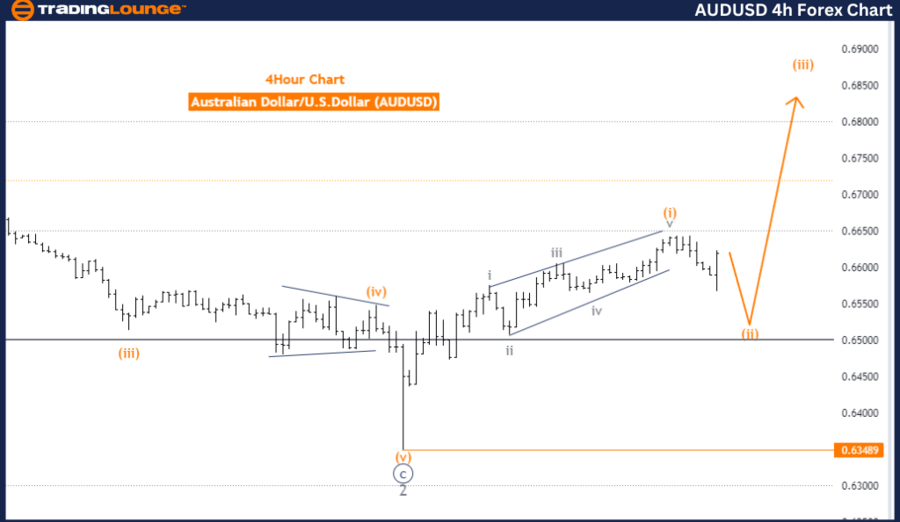
The AUDUSD 4-hour chart is currently experiencing a counter-trend movement according to Elliott Wave analysis. The market is in a corrective mode, characterized by a temporary movement against the primary trend. This corrective phase is identified as Orange Wave 2, indicating that the market is retracing or correcting the previous impulsive move of Orange Wave 1.
The structure being considered is Orange Wave 2, following the completion of Orange Wave 1. The completion of Orange Wave 1 suggests that the initial phase of the downtrend has concluded, and the market is now correcting that move through Orange Wave 2. This scenario is common in Elliott Wave analysis, where after a significant move in one direction, the market tends to pull back before resuming its primary trend.
The current market position is within Navy Blue Wave 1, a smaller degree wave within the larger structure of Orange Wave 2. This positioning indicates that the market is in the early stages of the corrective phase and could see further movement as this wave completes.
The direction of the next higher degrees is expected to follow Orange Wave 3. Once the correction of Orange Wave 2 is complete, the market is anticipated to resume its primary trend with Orange Wave 3, typically representing a strong and decisive movement in the direction of the overall trend, signaling the continuation of the downtrend.
A crucial level to monitor is the wave cancel invalid level set at 0.63489. If the market breaches this level, it would invalidate the current wave count, suggesting that the corrective phase has either ended or is taking a different form than initially anticipated.
In summary, the AUDUSD is currently in a corrective phase identified as Orange Wave 2, following the completion of Orange Wave 1. The market is positioned in Navy Blue Wave 1, with expectations of resuming the downtrend in Orange Wave 3 after the correction is complete. The wave cancel invalid level at 0.63489 is key to confirming this analysis.
AUD/USD four-hour chart
AUD/USD Elliott Wave technical analysis [Video]
Author

Peter Mathers
TradingLounge
Peter Mathers started actively trading in 1982. He began his career at Hoei and Shoin, a Japanese futures trading company.


