AUD/USD Elliott Wave technical analysis [Video]
![AUD/USD Elliott Wave technical analysis [Video]](https://editorial.fxstreet.com/images/Markets/Currencies/Majors/AUDUSD/focus-on-finances-8495984_XtraLarge.jpg)
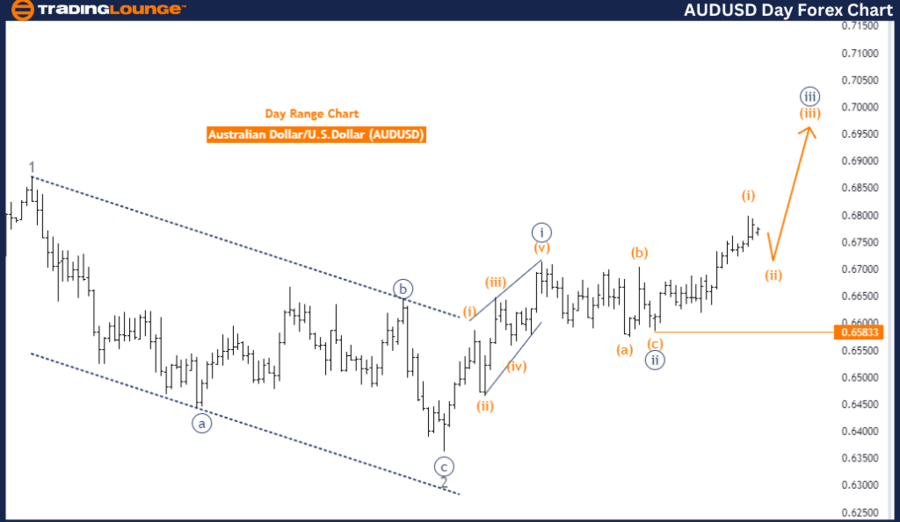
AUD/USD Elliott Wave Analysis Trading Lounge Day Chart.
AUD/USD Day Chart Analysis.
AUD/USD Elliott Wave technical analysis
Function: Trend.
Mode: Impulsive.
Structure: Navy Blue Wave 3.
Position: Gray Wave 3.
Next lower degree direction: Navy Blue Wave 4.
Details: Navy Blue Wave 2 appears complete at 0.65833; Navy Blue Wave 3 is active.
Wave cancel invalid level: 0.65833.
Overview
The AUD/USD Elliott Wave Analysis for the day chart focuses on identifying the current trend and wave structure within the market. This analysis characterizes the market behavior as impulsive, indicating a strong, directional move that aligns with the primary trend.
Current wave structure
-
The current wave structure under analysis is Navy Blue Wave 3, situated within Gray Wave 3.
-
This placement signifies that the market is experiencing an impulsive phase within a larger impulsive wave, suggesting robust upward momentum.
-
Navy Blue Wave 2 has been completed at the price level of 0.65833. This completion marks the end of the corrective phase of Navy Blue Wave 2 and signals the beginning of Navy Blue Wave 3.
Next lower degree direction
-
The direction for the next lower degrees is identified as Navy Blue Wave 4.
-
This indicates that after the completion of Navy Blue Wave 3, the market is expected to enter a corrective phase in the form of Navy Blue Wave 4 before continuing its primary trend.
-
The analysis highlights that the market is currently in Navy Blue Wave 3, following the completion of Navy Blue Wave 2.
Wave cancel invalid level
-
The wave cancel invalid level is set at 0.65833.
-
This level serves as a critical benchmark for traders, indicating the point at which the current wave count would be invalidated if the market price falls below it.
-
This invalidation point is essential for risk management, helping traders determine when to reassess their positions if the market does not move as expected.
Summary
-
The AUD/USD day chart analysis identifies an impulsive trend characterized by Navy Blue Wave 3 within Gray Wave 3.
-
The market has completed Navy Blue Wave 2 at 0.65833 and is now in the impulsive phase of Navy Blue Wave 3.
-
The wave cancellation invalid level at 0.65833 is crucial for maintaining the validity of the current wave count and for effective risk management.
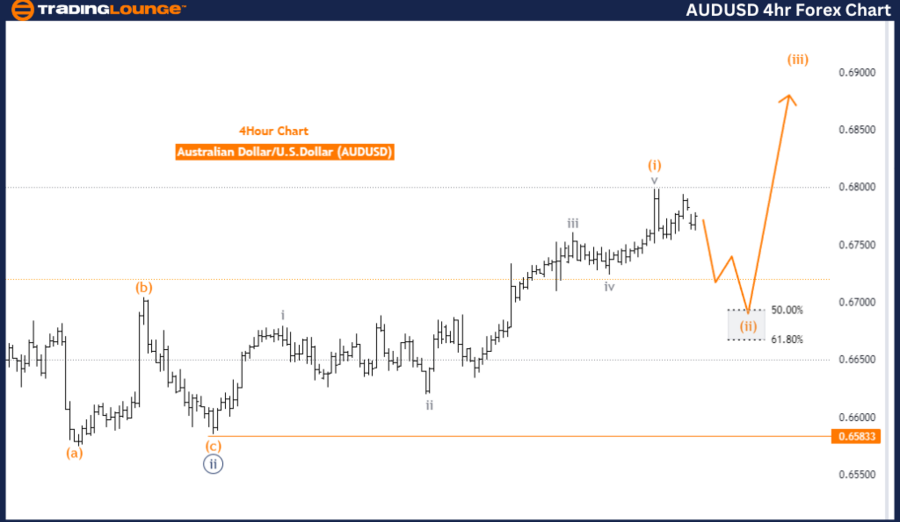
AUD/USD Elliott Wave Analysis Trading Lounge 4-Hour Chart.
AUD/USD 4-Hour Chart Analysis.
AUD/USD Elliott Wave technical analysis
Function: Counter Trend.
Mode: Corrective.
Structure: Orange Wave 2.
Position: Navy Blue Wave 3.
Next higher degree direction: Orange Wave 3.
Details: Orange Wave 1 appears complete at 0.67991; Orange Wave 2 is active.
Wave cancel invalid level: 0.65833.
Overview
The AUD/USD Elliott Wave Analysis for the 4-hour chart identifies the current market behavior as a counter-trend, indicating a corrective phase rather than a continuation of the primary trend.
Current wave structure
-
The wave structure under analysis is Orange Wave 2, situated within Navy Blue Wave 3.
-
This suggests that the market is undergoing a corrective phase within the larger third wave.
-
Orange Wave 1 has been completed at the price level of 0.67991. This completion marks the end of the initial wave in the current Elliott Wave sequence and sets the stage for the next wave.
Next higher degree direction
-
The direction for the next higher degrees is indicated as Orange Wave 3.
-
This implies that after the completion of the current corrective wave, the market is expected to resume its primary trend direction in the form of Orange Wave 3.
-
The analysis highlights that Orange Wave 1 has been completed at 0.67991, marking the end of the initial impulsive move and beginning the corrective phase of Orange Wave 2.
Current corrective phase
-
Currently, Orange Wave 2 is in play, representing a corrective phase within the larger structure.
-
This suggests that the market is undergoing a temporary pullback or consolidation.
-
The completion of Orange Wave 1 indicates that the market has finished its initial impulsive move and is now correcting itself in Orange Wave 2.
Wave cancel invalid level
-
The wave cancel invalid level is set at 0.65833.
-
If the market price drops below this level, it would invalidate the current wave count.
-
This invalidation point is crucial for traders as it serves as a benchmark for risk management. Breaching this level would suggest that the corrective phase has extended beyond expected parameters, indicating a potential shift in market dynamics.
Summary
-
The AUD/USD 4-hour chart analysis identifies a counter-trend corrective phase within the Elliott Wave structure, focusing on Orange Wave 2 within Navy Blue Wave 3.
-
The market has completed Orange Wave 1 at 0.67991 and is now in the corrective phase of Orange Wave 2.
-
The wave cancellation invalid level at 0.65833 serves as a critical point for risk management to validate the current wave count.
Technical analyst: Malik Awais.
AUD/USD Elliott Wave technical analysis [Video]
Author

Peter Mathers
TradingLounge
Peter Mathers started actively trading in 1982. He began his career at Hoei and Shoin, a Japanese futures trading company.


