AUD/USD Elliott Wave technical analysis [Video]
![AUD/USD Elliott Wave technical analysis [Video]](https://editorial.fxstreet.com/images/Markets/Currencies/Majors/AUDUSD/australian-money-36572798.jpg)
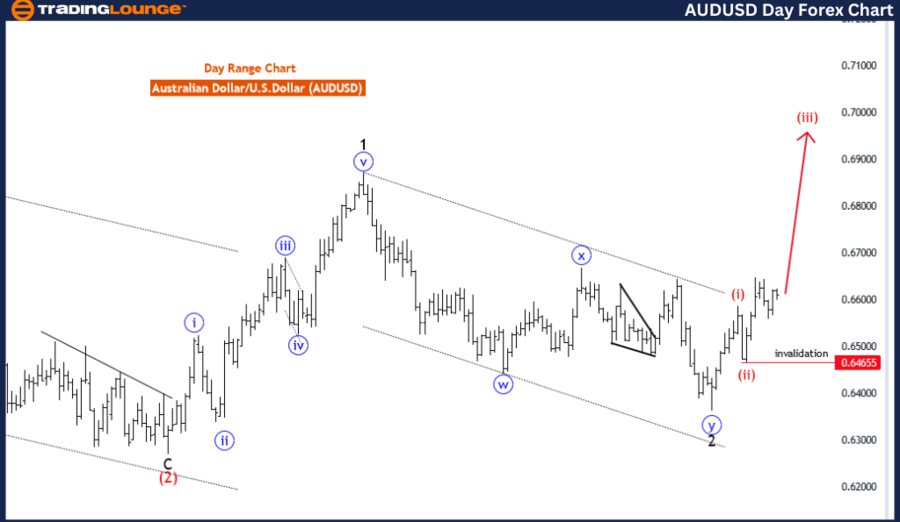
AUDUSD Elliott Wave Analysis Trading Lounge Day Chart,
Australian Dollar/U.S.Dollar (AUDUSD) Day Chart.
AUD/USD Elliott Wave technical analysis
Function: Trend.
Mode: Impulsive.
Structure: Red wave 3.
Position: Blue Wave 1.
Direction next lower degrees: Red wave 4.
Details: Red wave looking 2 completed, now red wave 3 of 1 is in play. Wave Cancel invalid level: 0.64655.
The daily chart for the Australian Dollar versus the U.S. Dollar (AUD/USD) indicates a broader trend following the Elliott Wave pattern. This type of analysis identifies the wave structure of a market and categorizes it into impulsive and corrective modes. An impulsive trend suggests strong directional movement with more substantial momentum.
Function
The function is defined as "Trend," indicating that the chart follows a broader directional pattern. This suggests the market has strong momentum, with prices likely moving consistently in one direction over time.
Mode
The mode of the structure is "impulsive," a key feature of Elliott Wave theory, typically indicating the market is progressing with force and momentum. Impulsive waves are generally part of a larger trend pattern that includes five distinct waves, with the third wave often being the most robust.
Structure
The structure described is "red wave 3," indicating that the market is in the midst of a strong, directional move. This wave typically signifies a powerful phase in a broader impulsive pattern, usually associated with significant price shifts.
Position
The position on the chart is "blue wave 1," suggesting that the first wave of the larger pattern has begun, indicating a new phase of trend movement.
Direction for next lower degrees
The next lower degrees indicate "red wave 4," suggesting that once the current impulsive wave completes, a corrective phase could occur before resuming the broader trend. This correction typically involves some consolidation or retracement before the next wave begins.
Details
The details section highlights that "red wave 2" has completed, suggesting that a period of consolidation or correction has concluded, and now "red wave 3" of "blue wave 1" is in play. The wave cancellation or invalidation level is set at 0.64655, which acts as a critical threshold. If prices move below this level, it could invalidate the current wave structure, potentially indicating a change in the broader trend.
In summary, the daily chart for AUD/USD follows an impulsive Elliott Wave structure in a trending market. The current phase is "red wave 3," suggesting robust momentum. The completion of "red wave 2" and the ongoing "red wave 3" indicate strong directional movement. The wave cancellation level at 0.64655 is crucial, as it represents a point where the current pattern could be invalidated if breached, signaling a potential trend change or corrective phase.
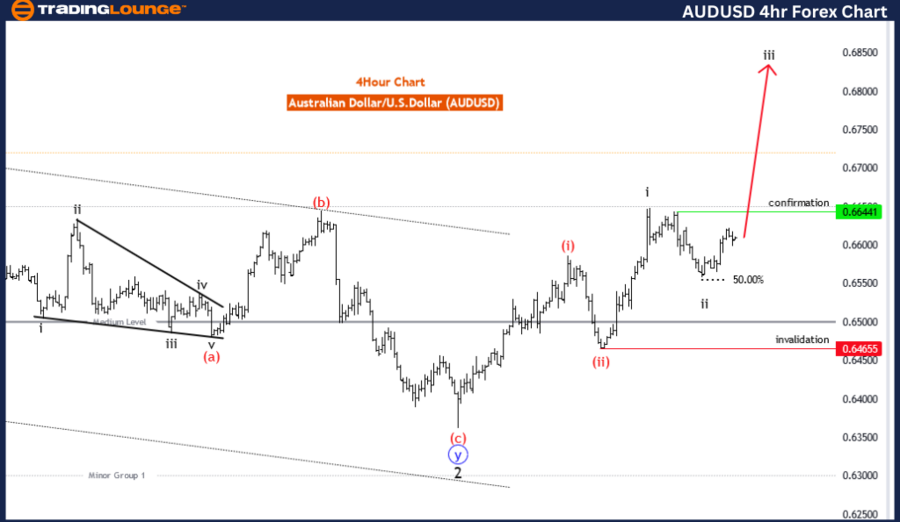
AUDUSD Elliott Wave Analysis Trading Lounge 4 Hour Chart,
Australian Dollar/U.S.Dollar (AUDUSD) 4 Hour Chart.
AUD/USD Elliott Wave technical analysis
Function: Trend.
Mode: Impulsive.
Structure: Black wave 3.
Position: Red wave 3.
Direction next lower degrees: Black Wave 4.
Details: Black wave looking 2 completed at 0.65578, now black wave 3 of 3 is in play. Wave Cancel invalid level: 0.64655.
The 4-hour chart of AUD/USD is currently indicating an impulsive trend according to Elliott Wave analysis. This suggests that the Australian Dollar against the U.S. Dollar is experiencing strong directional movement, usually indicative of significant momentum in one direction.
Function
The function of the current wave structure is "Trend," implying that the overall direction of the market is aligned with a broader trend, typically leading to consistent price movement in one direction over time.
Mode
The mode is "impulsive," reflecting a pattern of strong, direct movements with fewer corrections. Impulsive waves are often the driving force behind a major trend and usually consist of five waves (1, 2, 3, 4, and 5).
Structure
The structure is "black wave 3," indicating that the market is in the third wave of a larger trend pattern. This wave is generally the most robust and decisive, often associated with significant price changes and heightened market activity.
Position
The position is "red wave 3," suggesting that within the larger wave structure, the market is in the third sub-wave, which typically signifies strong directional movement and represents a significant phase of the broader trend.
Direction for next lower degrees
The direction for the next lower degrees is "black wave 4," indicating that after the current wave completes, a corrective phase may occur before resuming the larger trend. This phase often sees some retracement or consolidation in the market.
Details
The details section notes that "black wave 2" seems to have completed at 0.65578, suggesting that the corrective phase has concluded or is nearing completion. Currently, "black wave 3 of 3" is in play, indicating strong directional movement in the trend. The wave cancellation or invalidation level is set at 0.64655, marking a critical threshold where, if breached, the current wave pattern could be invalidated, potentially requiring a reassessment of the analysis.
n summary, the 4-hour chart for AUD/USD shows an impulsive trend with "black wave 3" in progress, signaling a strong market direction. The completion of "black wave 2" and the ongoing "black wave 3 of 3" suggest robust price movement. The wave cancellation level at 0.64655 is a key point to monitor, as breaching this level could necessitate a reevaluation of the current wave structure.
Technical analyst: Malik Awais.
AUD/USD Elliott Wave technical analysis [Video]
Author

Peter Mathers
TradingLounge
Peter Mathers started actively trading in 1982. He began his career at Hoei and Shoin, a Japanese futures trading company.


