AUD/NZD: evening Star on the daily chart, head, and shoulders on the H4

AUD/NZD produced a bearish engulfing candle on the daily chart yesterday. The combination of the last three candles has created a pattern called evening star. Thus, the pair may head towards the South this time. Major intraday charts have been playing with some interesting equations, though. Let us have a look at those three charts.
Chart 1 AUD/NZD Daily Chart
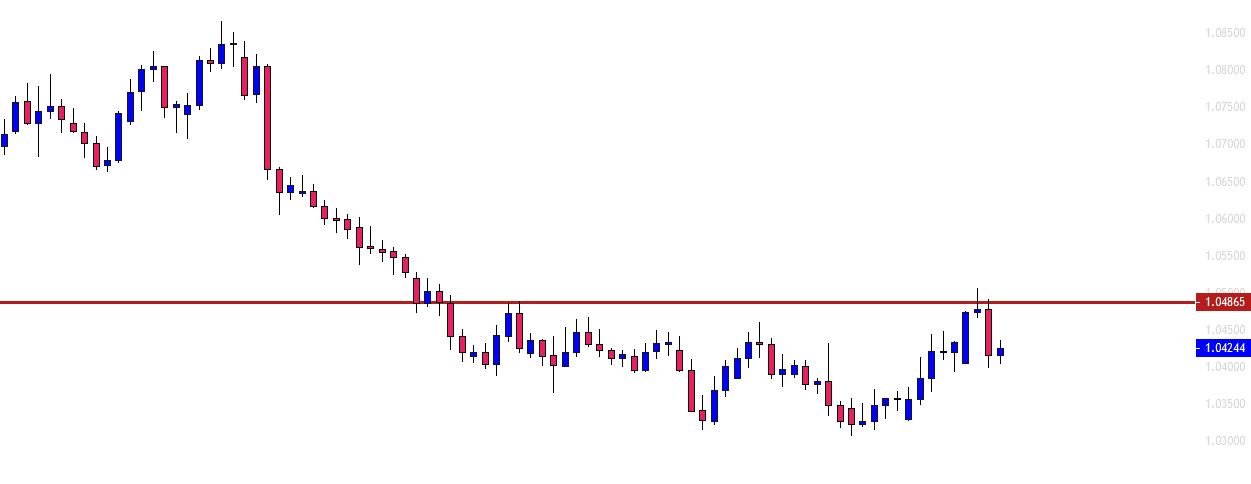
The chart shows that after being bullish, it produced a bearish pin bar at the level of 1.04865. The next candle came out as a bearish engulfing candle. This one is a strong bearish reversal pattern. Thus, the sellers may be keen to look for short opportunities. The price bounced off at the level of 1.03220 twice. Thus, it may find its next support around that level. The H4 chart traders must be very interested in the pair to go short after such price action. Let us have a look at the H4-AUD/NZD Chart.
Chart 2 AUD/NZD H4 Chart
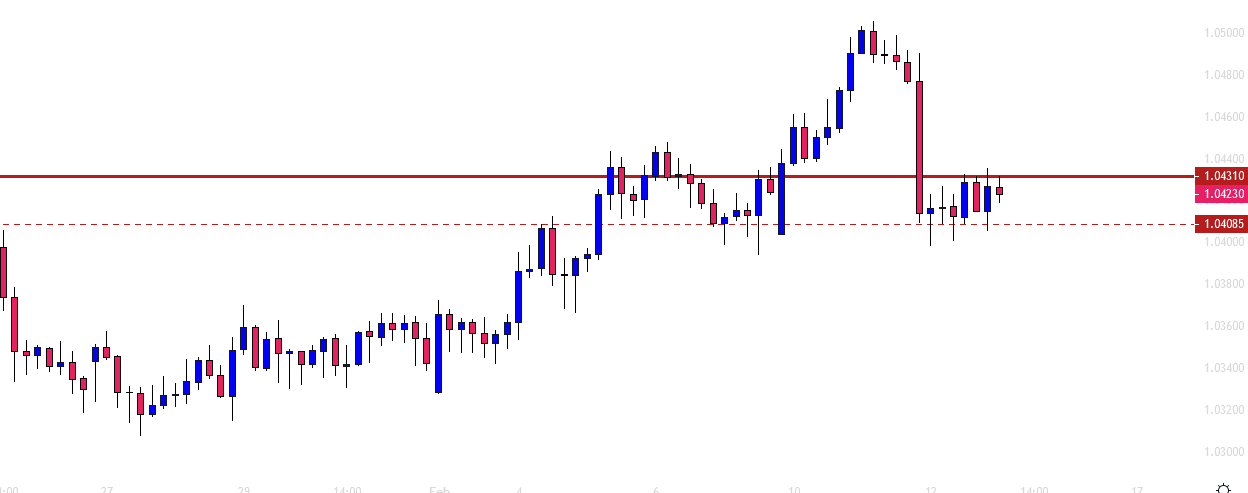
The chart shows that the price has been on strong consolidation between the levels of 1.04310 and 1.04085. The level of support looks strong. However, the evening star on the daily chart may help the pair make a bearish breakout. If the price makes a bearish breakout, it may find its next support at the level of 1.03665. The H4 chart holds another equation. It may end up producing a head and shoulder. Let us have a look at the chart below.
Chart 3 AUD/NZD H4 Chart
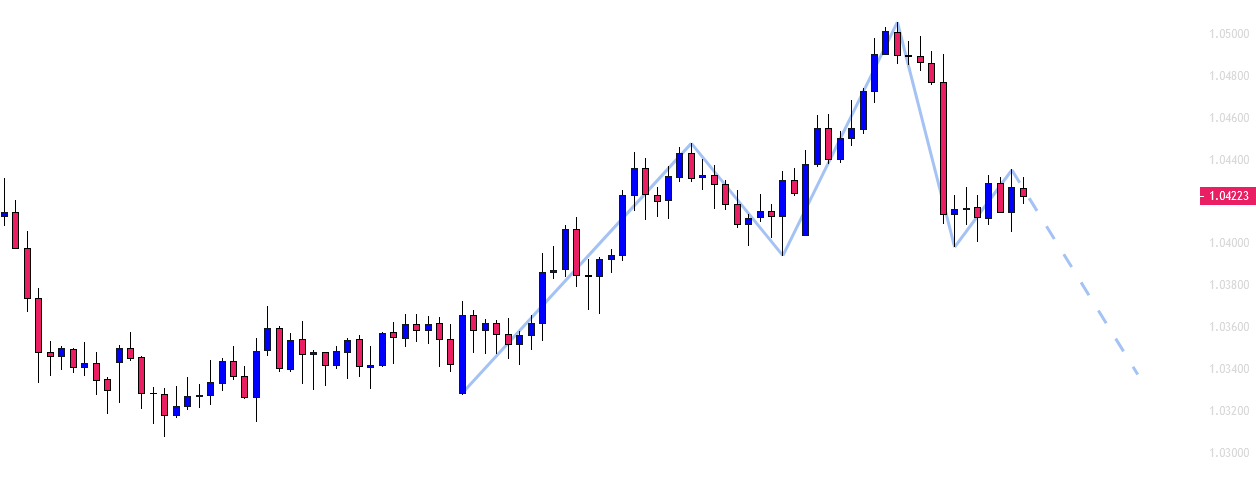
The chart shows if the price makes a bearish breakout, it may head towards the South to develop the last wave of the head and shoulder. The head and shoulder pattern suggests that the price may find its next support around the level of may hold their short entry up to the level of 1.03265.
Chart 4 AUD/NZD H1 Chart
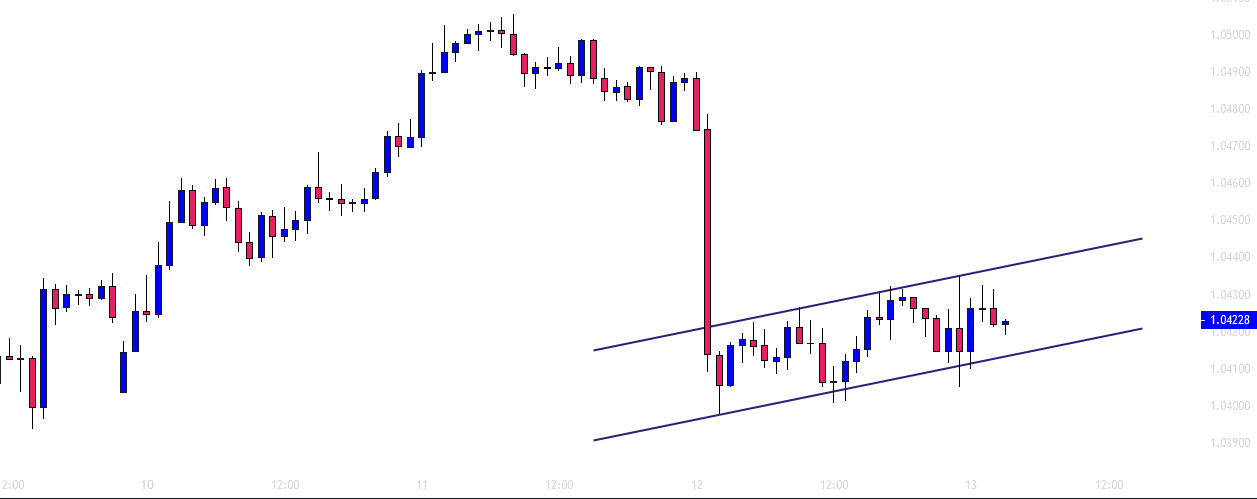
The price gets caught within an ascending channel. The price is heading towards the level of support again. The H1 buyers will be eying to go long on this chart upon getting a strong bullish reversal candle. On the other hand, the sellers are to wait for the price to be around the level of resistance and give them a chance to go short. Considering the H1 chart, the buyers have the upper hand.
The H1 chart looks good for the buyers, but the daily and the H4 chart look very good for the sellers. Thus, the pair may end up having another bearish day. If it really does and the daily candle closes below yesterday’s candle, the next H4 bearish wave may relatively be a stronger one.
Author

EagleFX Team
EagleFX
EagleFX Team is an international group of market analysts with skills in fundamental and technical analysis, applying several methods to assess the state and likelihood of price movements on Forex, Commodities, Indices, Metals and


