AUD/JPY produced a doji candle on the daily chart yesterday. The price made a long bearish move. It has been on a bullish correction. Yesterday’s doji candle suggests that the price may have found its resistance; thus, the price may get bearish and head towards the South. The H4 and the H1 chart look good for the bear as well. Therefore, the pair may have a bearish day today. Let us have a look at these three charts.


Chart 1 AUD/JPY Daily Chart

AUDJPY

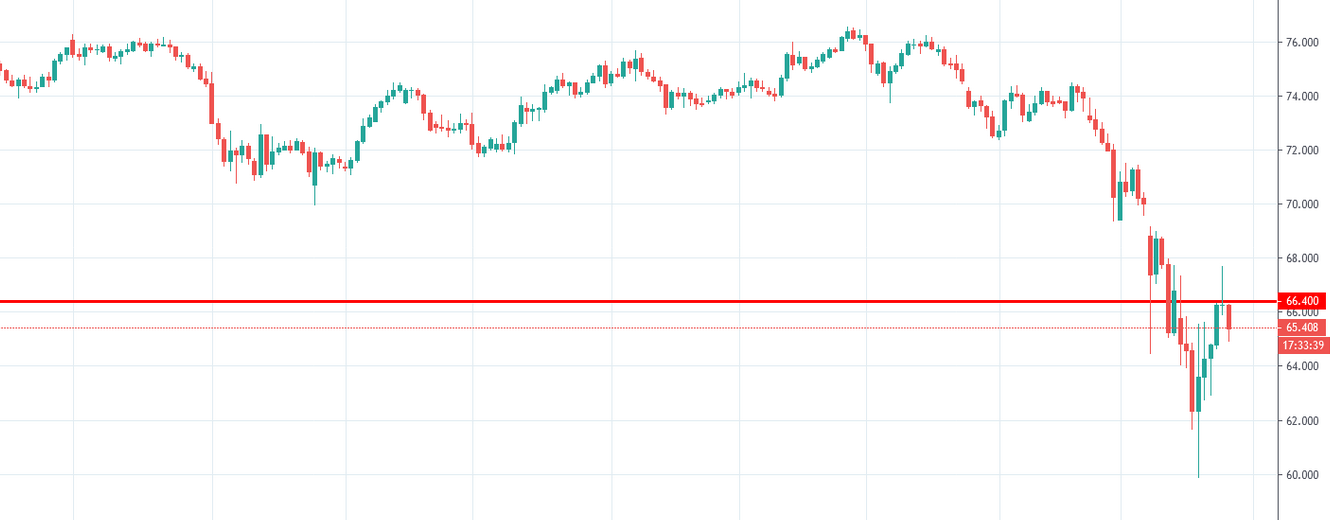
The chart shows that the price made a long bearish journey before it found its support around the 62.000 zone. It has been having a bullish correction since then. Yesterday’s daily candle came out as a doji candle, which is not a very strong reversal candle. However, if today’s candle comes out as a bearish engulfing candle, it would be an evening star, which is a strong bearish reversal candle. Thus, the sellers may eagerly wait for today’s daily candle.


Chart 2 AUD/JPY H4 Chart

AUDJPY

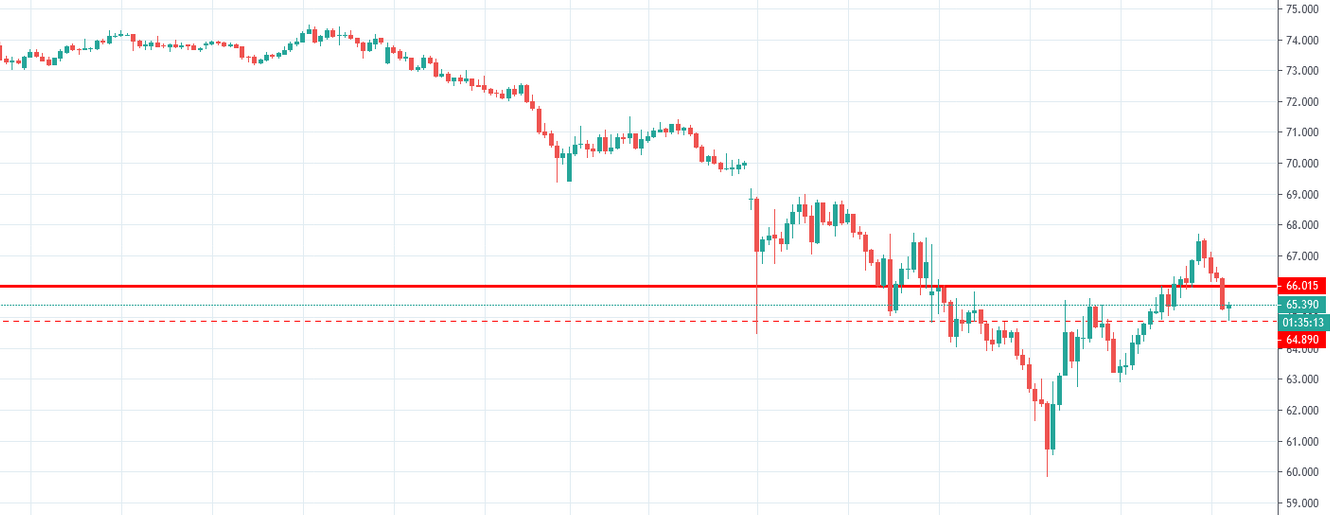
The H4 chart shows that the price made a bullish move upon ABC pattern. It had a rejection around the level of 67.400. Upon producing a bearish candle, it has been heading towards the South. The chart produced four consecutive bearish candles. The sellers should wait for the price to consolidate and create a bearish reversal candle followed by a breakout to offer them a short entry. The price may find its next support around the 63.230 level. If AUDJPY keeps going towards the North, the price may find its next resistance around the level of 67.400.


Chart 3 AUD/JPY H1 Chart

AUDJPY

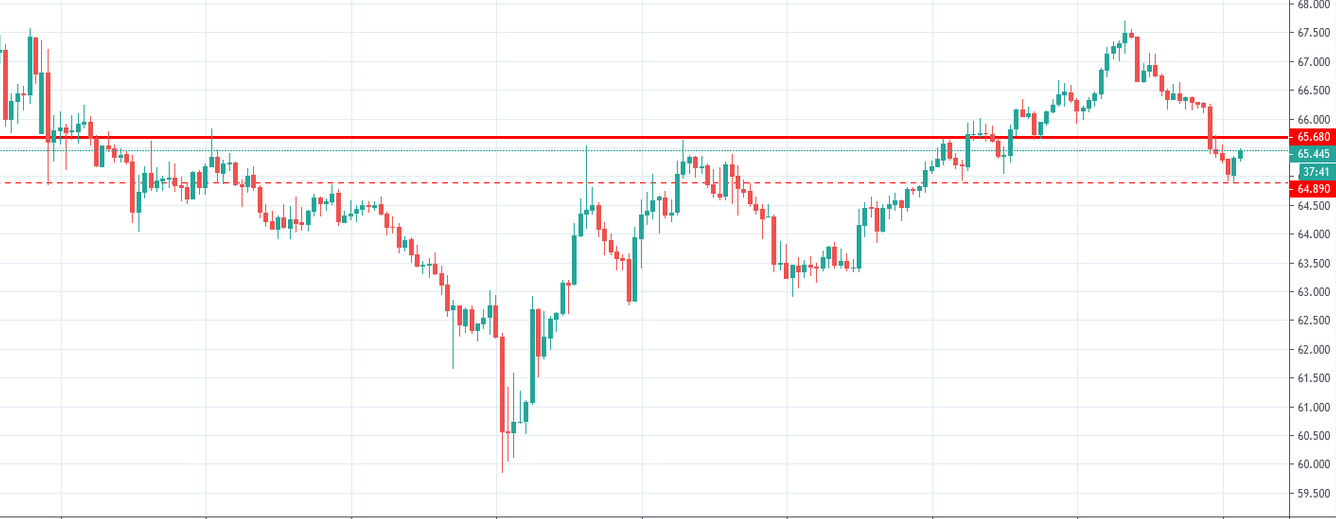
The H1 chart looks bearish too. The price made a correction and consolidated; it continued its bearish journey and found its support at the level of 64.890. The price has been heading up. The sellers should wait for the price to produce a bearish reversal candle followed by a breakout at the level of 64.890 to go short on the pair. The price may find its resistance around the level of 65.680. If the price makes gets bearish, the price may find its next support at the level of 64.135. In case of a bullish breakout, AUDJPY may find its next resistance around the level of 66.550.

The daily chart is not clearly bearish biased. However, the H4 and the H1 chart look good for the bear. Considering these three charts, the pair may end up having a bearish day today.


Try Secure Leveraged Trading with EagleFX!

Risk Warning: CFD and Spot Forex trading both come with a high degree of risk. You must be prepared to sustain a total loss of any funds deposited with us, as well as any additional losses, charges, or other costs we incur in recovering any payment from you. Given the possibility of losing more than your entire investment, speculation in certain investments should only be conducted with risk capital funds that if lost will not significantly affect your personal or institution’s financial well-being. Before deciding to trade the products offered by us, you should carefully consider your objectives, financial situation, needs and level of experience. You should also be aware of all the risks associated with trading on margin.

Recommended Content


Recommended Content

Editors’ Picks

AUD/USD tumbles toward 0.6350 as Middle East war fears mount

AUD/USD tumbles toward 0.6350 as Middle East war fears mount

AUD/USD has come under intense selling pressure and slides toward 0.6350, as risk-aversion intensifies following the news that Israel retaliated with missile strikes on a site in Iran. Fears of the Israel-Iran strife translating into a wider regional conflict are weighing on the higher-yielding Aussie Dollar. 

AUD/USD News

USD/JPY breaches 154.00 as sell-off intensifies on Israel-Iran escalation

USD/JPY breaches 154.00 as sell-off intensifies on Israel-Iran escalation

USD/JPY is trading below 154.00 after falling hard on confirmation of reports of an Israeli missile strike on Iran, implying that an open conflict is underway and could only spread into a wider Middle East war. Safe-haven Japanese Yen jumped, helped by BoJ Governor Ueda's comments. 

USD/JPY News

Gold price jumps above $2,400 as MidEast escalation sparks flight to safety

Gold price jumps above $2,400 as MidEast escalation sparks flight to safety

Gold price has caught a fresh bid wave, jumping beyond $2,400 after Israel's retaliatory strikes on Iran sparked a global flight to safety mode and rushed flows into the ultimate safe-haven Gold. Risk assets are taking a big hit, as risk-aversion creeps into Asian trading on Friday. 

Gold News

WTI surges to $85.00 amid Israel-Iran tensions

WTI surges to $85.00 amid Israel-Iran tensions

Western Texas Intermediate, the US crude oil benchmark, is trading around $85.00 on Friday. The black gold gains traction on the day amid the escalating tension between Israel and Iran after a US official confirmed that Israeli missiles had hit a site in Iran.

Oil News

Dogwifhat price pumps 5% ahead of possible Coinbase effect

Dogwifhat price pumps 5% ahead of possible Coinbase effect

Dogwifhat price recorded an uptick on Thursday, going as far as to outperform its peers in the meme coins space. Second only to Bonk Inu, WIF token’s show of strength was not just influenced by Bitcoin price reclaiming above $63,000.

Read more

Majors

Cryptocurrencies

Signatures