Technical analysis: Will AUD/JPY quotes go down?

AUD/JPY technical analysis summary
Below 90,6.
Sell Stop.
Above 96.
Stop Loss.
| Indicator | Signal |
| RSI | Neutral |
| MACD | Sell |
| MA(200) | Neutral |
| Fractals | Neutral |
| Parabolic SAR | Sell |
| Bollinger Bands | Neutral |
AUD/JPY chart analysis
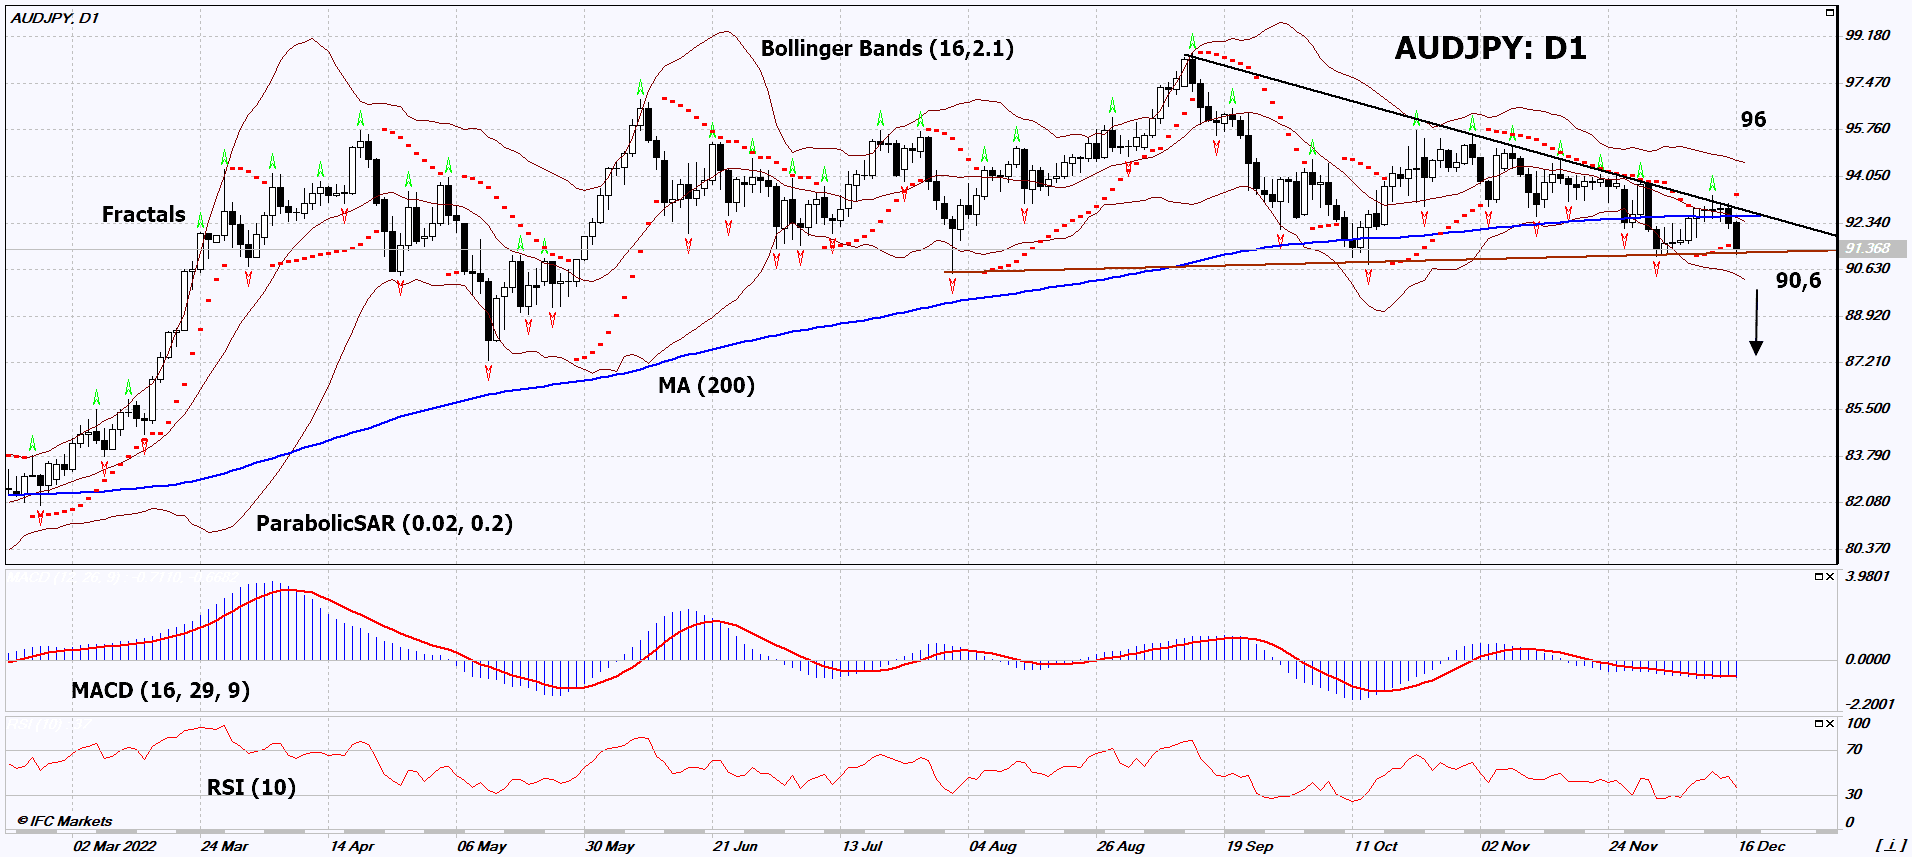
On the daily timeframe, AUDJPY: D1 broke down the 200-day moving average line and built a Triangle. Before opening a position, he must go down from the "Triangle". A number of technical analysis indicators formed signals for further decline. We do not rule out a bearish movement if AUDJPY: D1 falls below its most recent down fractal: 90.6. This level can be used as an entry point. The initial risk limit is possible above the last upper fractal, the upper Bollinger band and the Parabolic signal: 96. After opening a pending order, we move the stop following the Bollinger and Parabolic signals to the next fractal high. Thus, we change the potential profit/loss ratio in our favor. The most cautious traders, after making a trade, can switch to a four-hour chart and set a stop loss, moving it in the direction of movement. If the price overcomes the stop level (96) without activating the order (90.6), it is recommended to delete the order: there are internal changes in the market that were not taken into account.
Fundamental analysis of forex - AUD/JPY
The Australian dollar showed weakening. Will AUDJPY quotes go down?
Such dynamics is observed with the weakening of the Australian dollar against the Japanese yen. China is an important trading partner for Australia, so the Australian dollar often reacts to Chinese statistics. In this review, we consider the AUDJPY currency pair, but it can be noted that on December 15, AUDUSD showed the maximum daily decline since March 2020. This was facilitated by weak Chinese and Australian economic data. China Retail Sales and Industrial Production turned out to be worse than expected in November. In addition, in November, Chinese unemployment increased to a 5-month high of 5.7%. In Australia itself, the S&P Global Manufacturing PMI was also weaker than forecasts. In turn, Japanese economic indicators last week were relatively good. The meeting of the Bank of Japan (BoJ) will take place on December 20. If he somehow tightens his monetary policy, it could strengthen the yen. Recall that now the BoJ is the only global central bank with a negative rate of -0.1%.
Want to get more free analytics? Open Demo Account now to get daily news and analytical materials.
Want to get more free analytics? Open Demo Account now to get daily news and analytical materials.
Author

Dmitry Lukashov
IFC Markets
Dimtry Lukashov is the senior analyst of IFC Markets. He started his professional career in the financial market as a trader interested in stocks and obligations.


