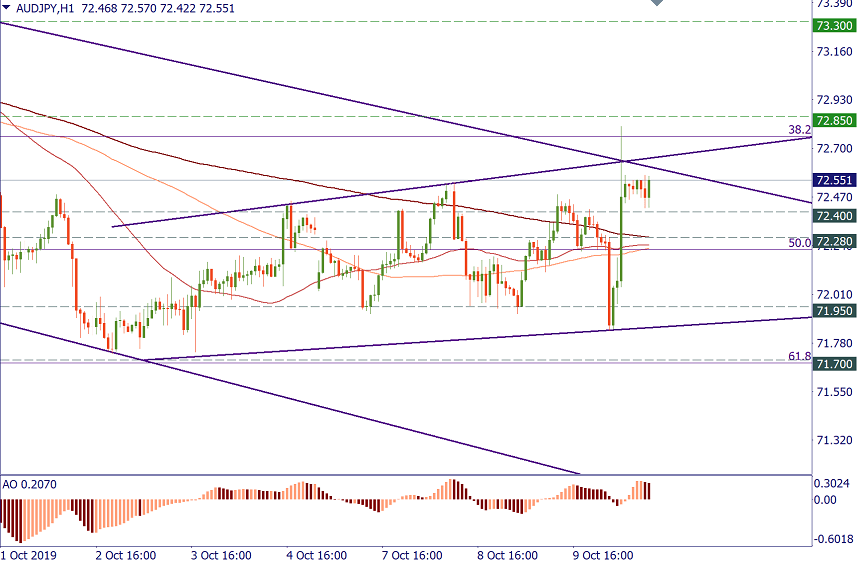
AUD/JPY is at resistance

AUD/JPY has reached the resistance line which is going down from September highs. The 100-period MA on the H4 chart is about to get below the 200-period one. Both lines limit the price action on the upside, around 72.70. The pattern on the H1 looks like “Spike and Ledge”: the break of the ledge’s lower border at 72.40 will bring the price down to 72.28 and 71.95. The switch to buying will be possible at 72.85, above the resistance line and the recent high. In this case, the target will be at 73.30 (previous resistance area).
Author

FBS Team
FBS
FBS team is a group of professional analysts focused on Forex, stock, and commodity markets. Each expert possesses a years-long experience in fundamental and technical analysis.
More from FBS Team


