AUD/JPY: Getting ready to make a bearish move

AUD/JPY produced a bearish Inside Bar on the daily chart. The candle forms right at the level, where the price had a rejection earlier. The daily chart suggests that the price may end up producing a Double Top. The neckline level is far enough for the intraday traders to go short on the pair with lucrative risk-reward. Thus, the pair may remain bearish for a while as far as the daily, the H4, and the H1 charts are concerned.
Chart 1 AUD/JPY Daily Chart
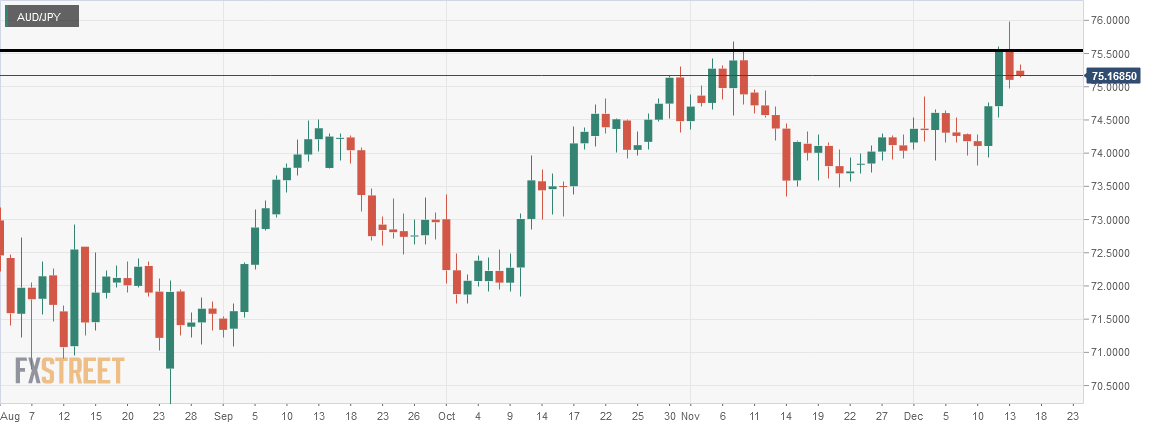
The chart shows that the price had a rejection at the level of 75.500 and headed towards the level of 73.5000. It headed towards the level of resistance again and produced the Inside Bar on Friday. Since it is a Double Top resistance, it may attract the intraday sellers to go short on the pair upon breakout. Major intraday charts such as the H4 and the H1 chart look bearish as well. Thus, AUDJPY may end up producing another bearish candle on the daily chart, which eventually may drive the price towards the South further.
Chart 2 AUD/JPY H4 Chart
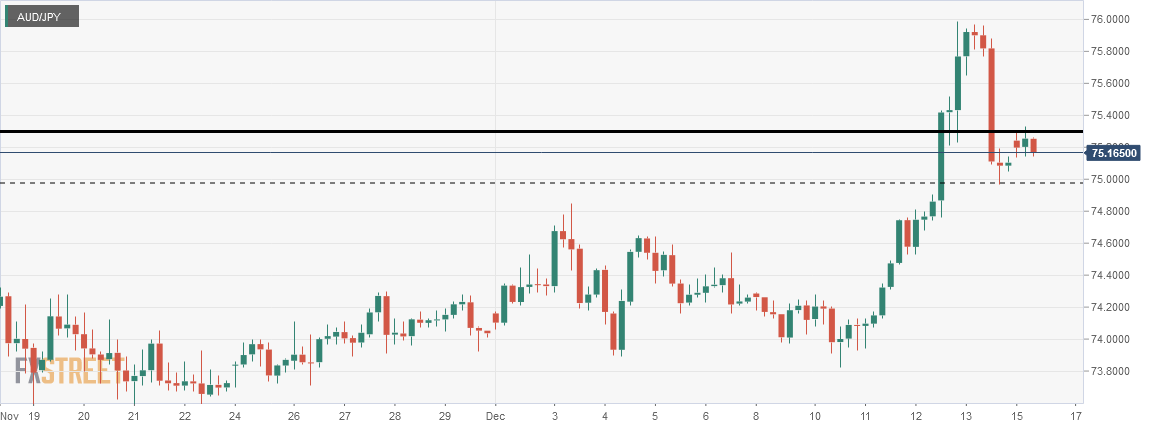
The chart shows that the price after producing a bearish engulfing candle headed towards the downside with good bearish momentum. As expected, it had a bounce at the round number 75.0000. It has been on consolidation, where the level of 75.30645 has been working as resistance. The level may end up producing a bearish reversal candle and a breakout at Friday's lowest low. If that happens, the H4 traders may go short on the pair and drive the price towards the level of 74.3770.
Chart 3 AUD/JPY H1 Chart
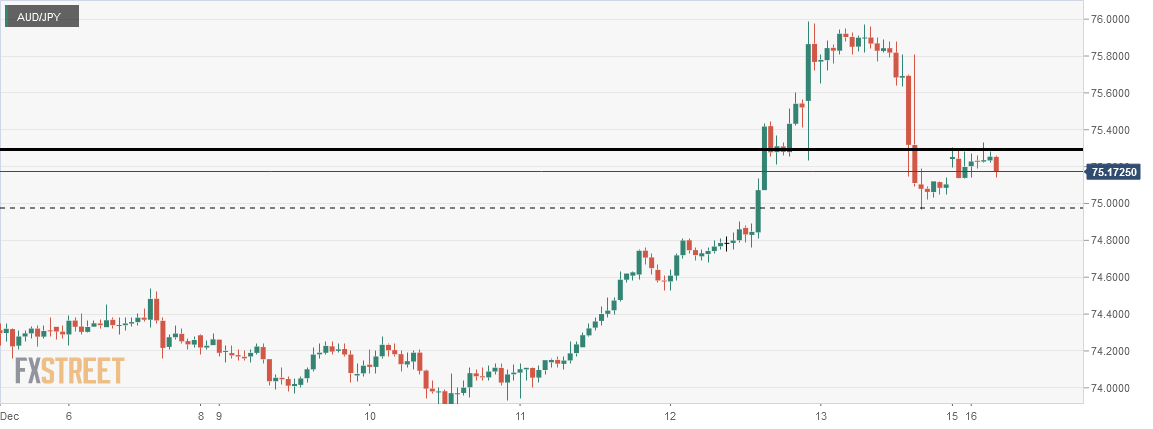
The H1 chart shows that the price finds its resistance, where it reacted heavily. It has produced several bearish reversal candles but has not been able to create the bearish momentum. As of writing, the last candle seems to be very bearish. If it continues to go towards the South and makes a breakout at the level of 75.0000, the H1 traders may go short to grab some green pips. The price may find its next support at the level of 74.5740 on the H1 chart. This allows a very lucrative risk-reward for the sellers.
The H4 and H1 charts look good for the sellers. A bearish Inside Bar usually is good for the buyers. Since it is a Double Top resistance, it may hold the buyers back. Meanwhile, intraday sellers may drive the price towards the South and make it more bearish.
Author

EagleFX Team
EagleFX
EagleFX Team is an international group of market analysts with skills in fundamental and technical analysis, applying several methods to assess the state and likelihood of price movements on Forex, Commodities, Indices, Metals and


