AUD/JPY Elliott Wave technical analysis [Video]
![AUD/JPY Elliott Wave technical analysis [Video]](https://editorial.fxstreet.com/images/Markets/Currencies/Crosses/XAUUSD/gold-ingot-19143567_XtraLarge.jpg)
AUD/JPY Elliott Wave technical analysis
Function: Trend.
Mode: Impulsive.
Structure: Red wave 3.
Position: Blue wave 1.
Direction next higher degrees: Red wave 4
Details: Red wave 2 of 1 looking completed at 98.234, now red wave 3 of 1 is in play . Wave Cancel invalid level: 99.078
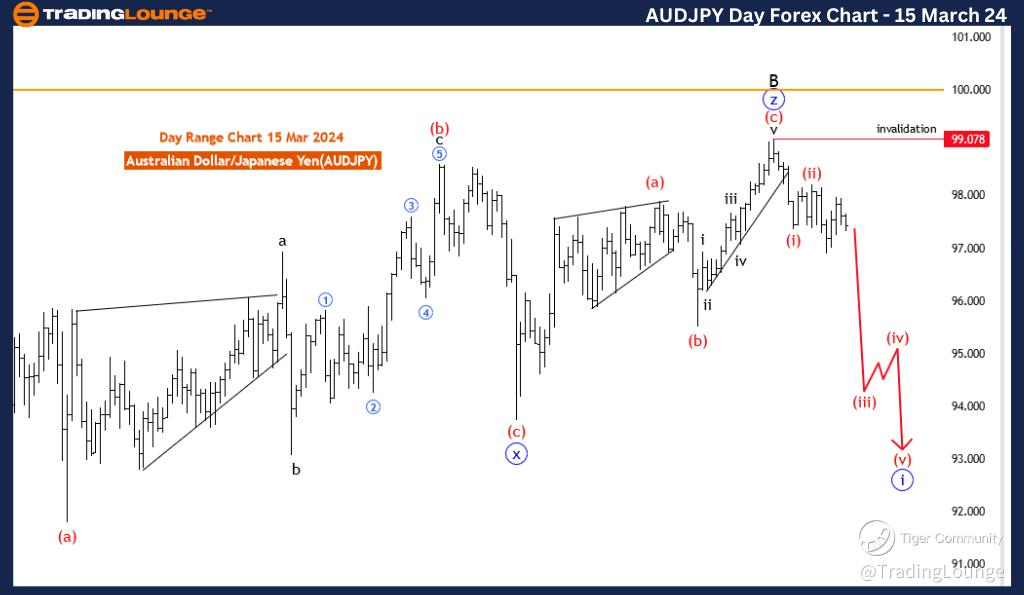
The AUD/JPY Elliott Wave Analysis for the day chart on 15 March 24, offers insights into potential price movements in the Australian Dollar/Japanese Yen currency pair, applying Elliott Wave principles within the framework of technical analysis.
Identified as a "Trend" scenario, the analysis suggests a focus on capturing and interpreting price movements aligned with the prevailing direction, indicating an ongoing upward trend in the pair.
Described as "impulsive," the "MODE" indicates that the current price action displays characteristics of impulsive waves within Elliott Wave theory. Impulsive waves typically represent strong and directional movements in the market.
The "STRUCTURE" is labeled as "Red wave 3," signifying the current phase within the broader Elliott Wave count. This suggests that the market is currently experiencing a significant upward movement, likely the third wave within the larger Elliott Wave cycle.
Positioned as "Blue wave 1," the analysis indicates that the current price movement is part of the initial wave within the ongoing Elliott Wave count. This implies that the market has recently initiated a new upward cycle after completing a corrective phase.
The "DIRECTION NEXT HIGHER DEGREES" is identified as "red wave 4," suggesting the anticipated direction for the subsequent higher-degree wave. This implies an expectation of a corrective phase following the completion of the current upward wave.
In the "DETAILS" section, it is mentioned that "red wave 2 of 1 looking completed at 98.234, now red wave 3 of 1 is in play." This indicates that the previous corrective phase has concluded, and the market is now in the midst of the third wave of the current cycle.
The "Wave Cancel invalid level" is specified as 99.078, serving as a critical threshold. A breach beyond this level would invalidate the current wave count, necessitating a reassessment of the analysis.
In summary, the AUD/JPY Elliott Wave Analysis for the day chart on 15 March 24, suggests a trend scenario characterized by impulsive upward movements, with the market currently in the third wave of the ongoing cycle. The Wave Cancel invalid level provides a reference point for monitoring potential shifts in the wave count and trend dynamics.
AUD/JPY Elliott Wave technical analysis
Function: Trend
Mode: Impulsive
Structure: Red wave 3
Position: Blue wave 1
Direction next higher degrees: Red wave 4
Details: Red wave 2 of 1 looking completed at 98.234, now red wave 3 of 1 is in play . Wave Cancel invalid level: 99.078
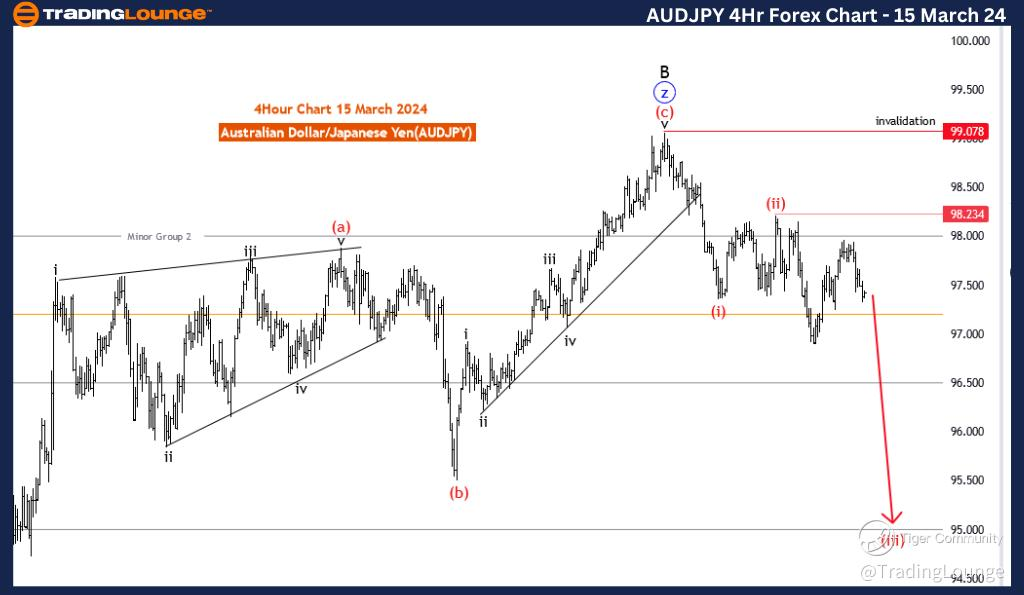
The AUD/JPY Elliott Wave Analysis for the 4-hour chart on 15 March 24, offers insights into potential price movements in the Australian Dollar/Japanese Yen currency pair, utilizing Elliott Wave principles within the framework of technical analysis.
Identified as a "Trend" scenario, the analysis focuses on capturing and interpreting price movements aligned with the prevailing direction. This suggests an emphasis on identifying opportunities to participate in the ongoing upward movement in the pair.
Described as "impulsive," the "MODE" indicates that the current price action exhibits characteristics of impulsive waves within Elliott Wave theory. Impulsive waves typically represent strong and directional movements in the market.
The "STRUCTURE" is labeled as "Red wave 3," signifying the current phase within the broader Elliott Wave count. This suggests that the market is currently in the midst of a significant upward movement, likely the third wave within the larger Elliott Wave cycle.
Positioned as "Blue wave 1," the analysis indicates that the current price movement is part of the initial wave within the ongoing Elliott Wave count. This implies that the market has just begun a new upward cycle after completing a corrective phase.
The "DIRECTION NEXT HIGHER DEGREES" is identified as "red wave 4," suggesting the anticipated direction for the subsequent higher-degree wave. This implies an expectation of a corrective phase following the completion of the current upward wave.
In the "DETAILS" section, it is mentioned that "red wave 2 of 1 looking completed at 98.234, now red wave 3 of 1 is in play." This indicates that the previous corrective phase has concluded, and the market is now in the midst of the third wave of the current cycle.
The "Wave Cancel invalid level" is specified as 99.078, serving as a critical threshold. A breach beyond this level would invalidate the current wave count, necessitating a reassessment of the analysis.
In summary, the AUD/JPY Elliott Wave Analysis for the 4-hour chart on 15 March 24, suggests a trend scenario characterized by impulsive upward movements, with the market currently in the third wave of the ongoing cycle. The Wave Cancel invalid level provides a reference point for monitoring potential shifts in the wave count and trend dynamics.
AUD/JPY Elliott Wave technical analysis [Video]
Author

Peter Mathers
TradingLounge
Peter Mathers started actively trading in 1982. He began his career at Hoei and Shoin, a Japanese futures trading company.


