AU Unemployment Rises - RBA To Ease Again In October?

bbfh
Headline employment data disappointed, increasing the probability of another RBA cut in their October meeting.
- Unemployment rose to 5.3% (as expected, but the highest rate since August 2016). Last month was also upwardly revised to 5.3% from 5.2%.
- +34.7 jobs were added, yet the headline figure was propped up by part-time workers
- Full-time jobs fell by -15.5k. As a % of all jobs, it’s the lowest since June 2018.
- Participation rate hits a new record high (on weaker FT employment and higher unemployment…)
RBA September minutes, final paragraph:
“Members would assess developments in both the international and domestic economies, including labour market conditions, and would ease monetary policy further if needed to support sustainable growth in the economy and the achievement of the inflation target over time.”
RBA have been keeping a close eye on employment for a whilst now, yet the data continues to point the wrong way. We’ll keep an ear to the ground for any comments from Philip Lower ahead of the next meeting as the RBA have mostly dropped their easing clues during public events. But, given the deteoration of fulltime employment and higher unemployment, it appears increasingly likely RBA could ease. But for now, traders aren’t waiting to find out and selling the Aussie anyway.
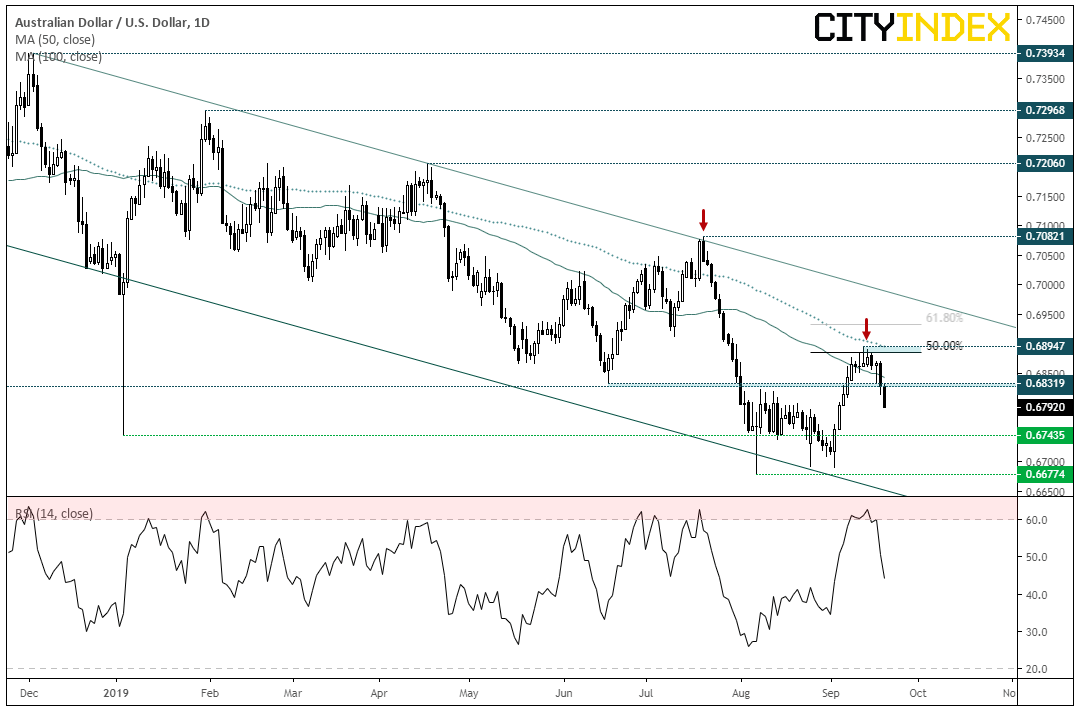
AUD/USD has slammed through key support, a level bulls tried to defend by closing on the level by US close. A retracement from the multi-year lows had lost momentum near the 50% retracement level, before testing support with a bullish pinbar. Not that it helped as bearish momentum has picked up notably since the Fed’s hawkish cut and of course weak Australian employment data. So it appears the high is in, and bears could look to fade into minor rallies below 0.6832, or reassess if resistance breaks. However, given the established bearish trend and potential for further easing, we remain bearish below the 0.6895 high.
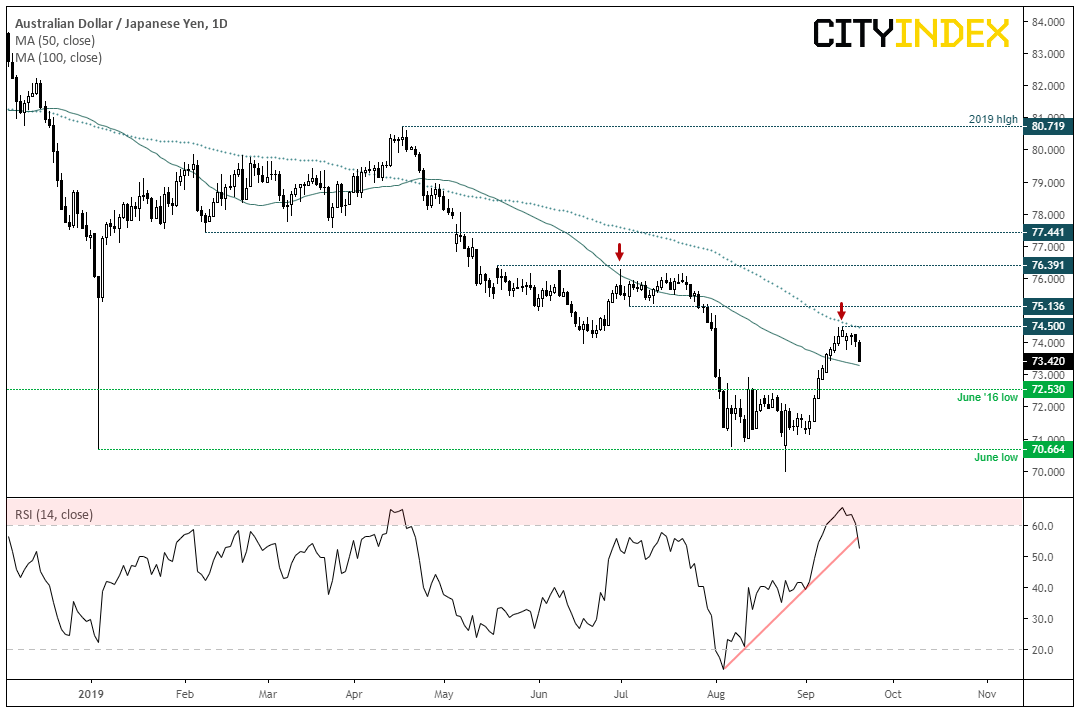
AUD/JPY is the biggest mover of the session and currently the only pair to reach its typical daily range (give it time, sure others will catch up). A trade-truce driven rally stalled around the 100-day MA and RSI has dipped back below 60 (a level which can be used as overbought during a downtrend). RSI has broken its own trendline, although price action is on the cusp of testing the 50-day MA. Whilst this could provide interim support, we remain bearish below 74.50 and bears could look to target the 2016 low around 72.53.
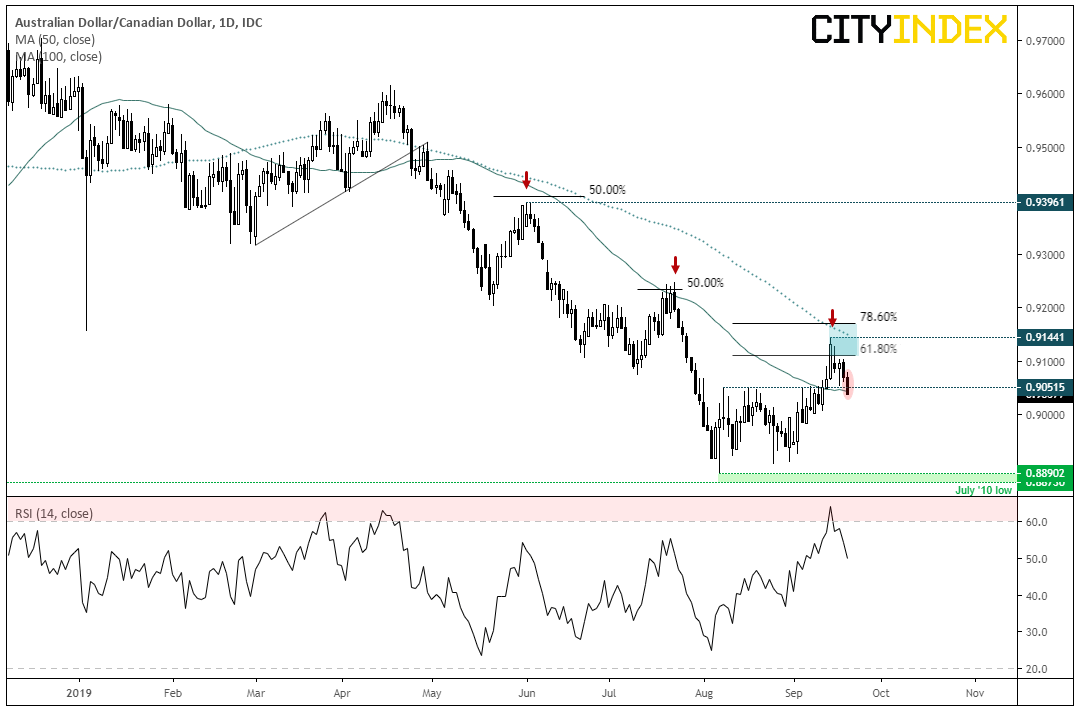
AUD/CAD has broken beneath 0.9052 support and breached its 20-day MA. The daily chart remains within an established bearish trend, although the recent retracement has bee the deepest having traded beyond the 61.8% Fibonacci ratio (not quite testing the 78.6%). RSI has recently fallen back below 60 which, in a downtrend could be considered as ‘overbought’. Given Canadian economic data continues to outperform, we suspect momentum has now realigned with the dominant, bearish trend.
Related analysis:
Kiwi Crosses Point Towards Further Weakness Ahead
Author

Matt Simpson, CFTe, MSTA
CityIndex
Matt Simpson is a certified technical analyst who combines charts and fundamentals to generate trading themes.


