AT&T Showing Elliott Wave Impulsive Sequence

AT&T Short term Elliott Wave view suggests that the decline to November 06 low 32.56 ended Cycle wave X. A rally from there is unfolding as an impulse Elliott Wave structure with extension in 3rd swing higher and each leg has internal oscillations of 5 waves thus favoring it to be an impulse. These possible 5 waves move higher should end Minor wave 1 in an Impulse sequence or a wave C of a FLAT correction from 10/25 low (33.34). In either case, after 5 waves move ends, the stock should pull back in 3 waves at least as the Elliott Wave Theory suggests.
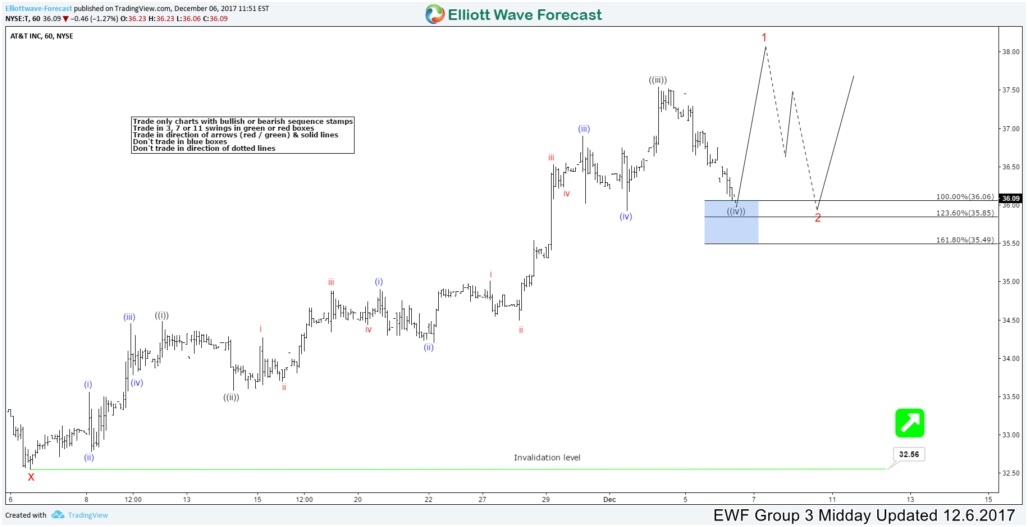
Up from 32.56 low Minute wave ((i)) ended 34.45, Minute wave ((ii)) ended at 33.59 low, Minute wave ((iii)) ended at 37.52 on 12/04 peak. Below from there, Minute wave ((iv)) pullback in progress for the correction of 33.59 cycle towards 36.06-35.49 100%-161.8% Fibonacci retracement area. Then from there, as far as a pivot from 33.59 low stays intact the stock is expected to resume the upside to complete a 5 waves impulse in wave 1. Afterwards, stock should pull back in wave 2 to correct the cycle from 32.56 X low. We don’t like selling it and we expect short-term buyers to appear in 36.06-35.49 area for a 3 wave bounce at least.
AT&T 1 Hour Elliott Wave Chart

Become a Successful Trader and Master Elliott Wave like a Pro. Start your Free 14 Day Trial at - Elliott Wave Forecast.
Author

Elliott Wave Forecast Team
ElliottWave-Forecast.com


