SPX Elliott Wave View: At Weekly Inflection Area

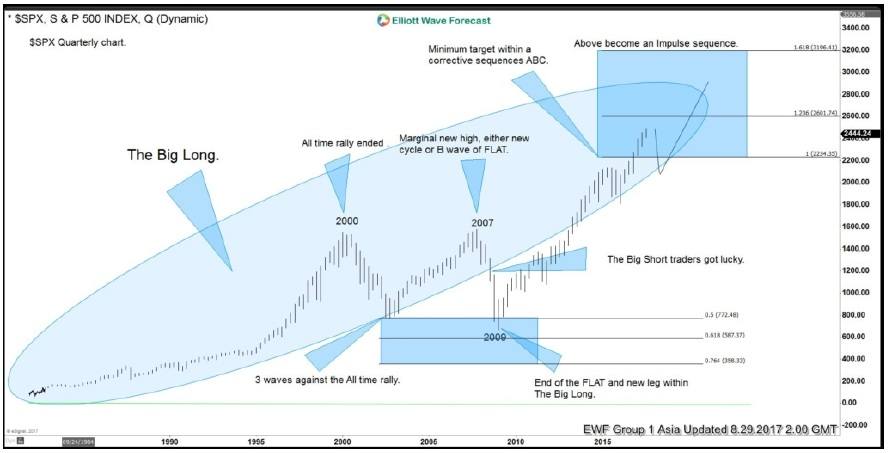
SPX S&P 500 Long Term Elliott Wave view suggests that the Index has reached the minimum target at 2234.35 to end a big cycle from an all time low. If we assume the Index starts from all-time low of 0, then the rally can be labelled as a zigzag Elliott Wave structure. The first leg wave A ended in March 2000 at 1553.11 during the dot com bubble. From 2000 peak, the Index corrected in 3 waves and reached 50% retracement at 766.67 in the year 2002. SPX then started a new leg higher which broke above 2000 peak in October 2007. Technically, with the break above 2000 peak, S&P formed a bullish sequence (a higher high) from all-time low and the natural path is to extend higher, especially considering that it has corrected 50% into 2002.
As SPX formed a new peak in the year 2007, the Market did an unexpected detour. Instead of the natural path of extending higher, the Index declined strongly in 5 waves into the year 2009 during the financial crisis due to subprime mortgage default and collapse of Lehman Brothers. This collapse is even captured in the movie titled "The Big Short" when several traders made money by correctly betting on the ensuing crash. In reality however, these traders got lucky as they were trading against a natural cycle, which happens only in a wave C of a FLAT structure.
The decline broke below 2002 low, sentiment was very negative at that time and no one was talking about buying the Index. What people don't realize is that the Market is a reflection of human progress and thus it should never go back to zero. Correction is natural and allows the market to reset. The Market ended a 3-3-5 Expanded Flat Elliott Wave structure in 2009 and then began the Big Long. Interestingly, nobody is filming or talking about the Big Long, and nowadays most people still talk about the impending big crash almost every single year even when the market keeps rallying. Almost nobody is talking about how great the move higher is as people don't understand the primary trend in the human nature is up.
Right now, S&P has reached an interesting weekly inflection area in which we can label the entire move from all time 0 as a zigzag Elliott Wave Structure. Wave A started from all-time 0 to 2000 high. The 3 waves correction from 2000 high to 2009 low is labelled as wave B and take the form of Expanded Flat. Then from 2009 low to present day, it is labelled as wave C. The minimum target wave C = A at 2234.35 has been reached, but that doesn't mean the Indices will crash from here. We acknowledge that the Index could indeed have a decent pullback from this area, but keep in mind that it's possible for the Index to extend higher within the blue box at 2234.35 (100% of A-B) – 3196.41 (161.8% of A-B). If the Index reaches 3196.41, then the whole move from all-time 0 can be labelled instead as 1-2-3. If reaching 3196.4, the third wave in this case is extended, which is the typical characteristic of wave 3 in an impulse. Thus the Big Long at this point in time can even become an extra Big Long, until it gets denied.
SPX S&P 500 Long Term Elliott Wave Chart
Become a Successful Trader and Master Elliott Wave like a Pro. Start your Free 14 Day Trial at - Elliott Wave Forecast.
Author

Elliott Wave Forecast Team
ElliottWave-Forecast.com