ASX 200 - Preparing for a Corrective Move

The Australian stock index ASX 200, in its hourly chart, shows a corrective formation as a flag pattern, which makes us expect a new bearish movement.
According to the traditional technical analysis, the flag pattern is a chartist formation that calls for the continuation of the previous move. In work developed by Thomas Bulkowski, the author of "Encyclopedia of Chart Patterns," the author concludes that the flag pattern tends to have a failure rate of less than 5%.
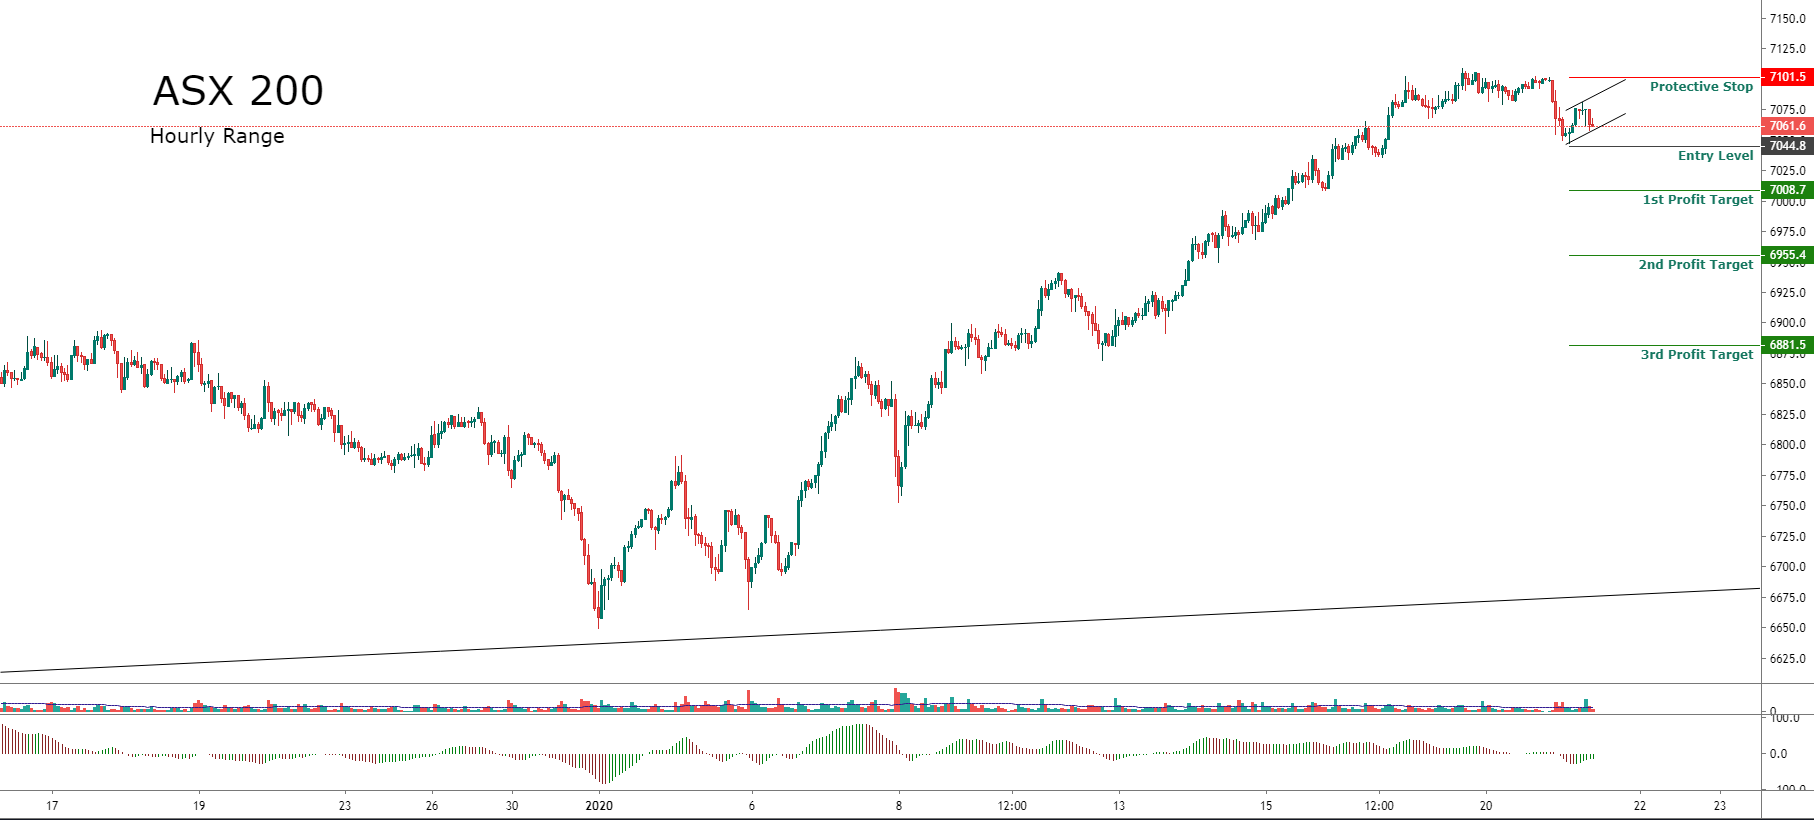
The short-side positioning will active id the price breaks down and closes below 7,044.8 pts. In a conservative outlook, we foresee a potential first target at 7,008.7 pts.
If the price continues its drops, the Australian index could drop to 6,955.4 pts and extend until 6,881.5 pts.
The invalidation level of our bearish setup locates at 7,101.5 pts.
Trading Plan Summary
Entry Level: 7,044.8 pts.
Protective Stop: 7,101.5 pts.
1st Profit Target: 7,008.7 pts.
2nd Profit Target: 6,955.4 pts.
3rd Profit Target: 6,881.5 pts.
Author

EagleFX Team
EagleFX
EagleFX Team is an international group of market analysts with skills in fundamental and technical analysis, applying several methods to assess the state and likelihood of price movements on Forex, Commodities, Indices, Metals and


