As the Markets Hit New Highs

Good Morning Traders,
As of this writing 6 AM EST, here’s what we see:
US Dollar: Sept USD is Down at 96.405.
Energies: Aug '19 Crude is Up at 60.33.
Financials: The Sept 30 year bond is Down 12 ticks and trading at 153.11.
Indices: The Sept S&P 500 emini ES contract is 10 ticks Higher and trading at 3018.00.
Gold: The Aug Gold contract is trading Up at 1417.80. Gold is 56 ticks Higher than its close.
Initial Conclusion
This is not a correlated market. The dollar is Down- and Crude is Up+ which is normal and the 30 year Bond is trading Lower. The Financials should always correlate with the US dollar such that if the dollar is lower then bonds should follow and vice-versa. The S&P is Higher and Crude is trading Higher which is not correlated. Gold is trading Higher which is correlated with the US dollar trading Down. I tend to believe that Gold has an inverse relationship with the US Dollar as when the US Dollar is down, Gold tends to rise in value and vice-versa. Think of it as a seesaw, when one is up the other should be down. I point this out to you to make you aware that when we don't have a correlated market, it means something is wrong. As traders you need to be aware of this and proceed with your eyes wide open.
Currently all of Asia is trading Higher with the exception of Singapore which is fractionally Lower. All of Europe is trading Lower at this time.
Possible Challenges To Traders Today
-
Empire State Manufacturing Index is out at 8:30 AM EST. This is major.
-
FOMC Member Williams Speaks at 8:50 AM EST. This is major.
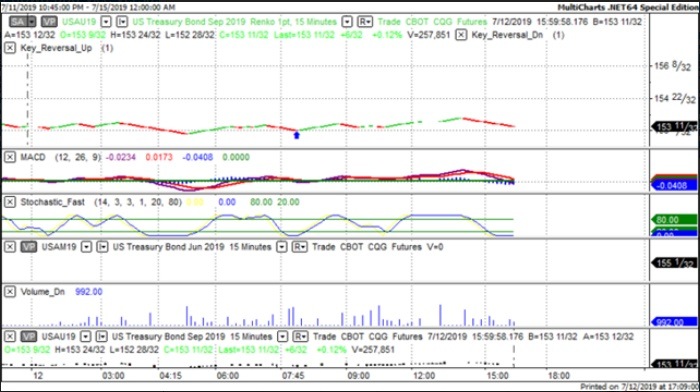
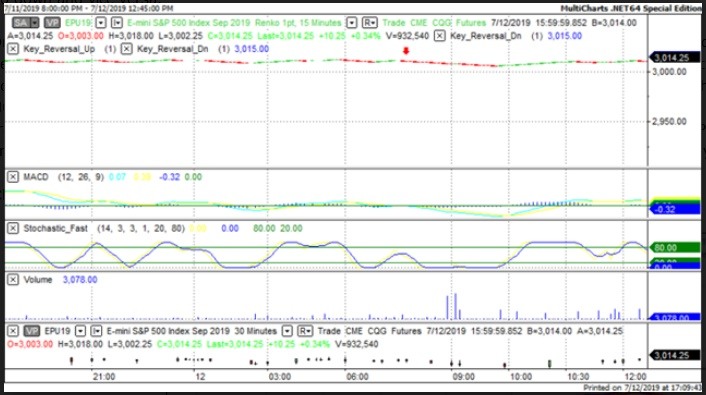
Treasuries
We've elected to switch gears a bit and show correlation between the 30 year bond (ZB) and The YM futures contract. The YM contract is the DJIA and the purpose is to show reverse correlation between the two instruments. Remember it's liken to a seesaw, when up goes up the other should go down and vice versa.
On Friday the ZB made a major move at around 8 AM EST. The ZB hit a Low at around that time and the YM hit a High. If you look at the charts below ZB gave a signal at around 8 AM EST and the YM was moving Lower at the same time. Look at the charts below and you'll see a pattern for both assets. ZB hit a Low at around 8 AM and the YM was moving Lower at the same time. These charts represent the newest version of MultiCharts and I've changed the timeframe to a 15 minute chart to display better. This represented a Long opportunity on the 30 year bond, as a trader you could have netted about 15 ticks per contract on this trade. Each tick is worth $31.25. Please note: the front month for both the ZB and YM contract is now September, 2019 and I've changed the format to Renko bars such that it may be more apparent and visible.
Charts Courtesy of MultiCharts built on an AMP platform.
Bias
On Friday our bias was to the Upside and the markets didn't disappoint. The Dow rose by 244 points and the other indices gained ground as well. Today we aren't dealing with a correlated market and our bias is to the Upside.
Could this change? Of Course. Remember anything can happen in a volatile market.
Commentary
It seems as though each and every day the markets wish to hit higher highs and avoid lower lows. So as the markets hits new highs what are the analysts and pundits saying? They're saying "watch out the markets could fall at any moment, we could have a pullback, the economy could weaken, etc." It is true that the markets in the short term may rise and fall, pullback and consolidate. This is normal because whatever goes up must come down and vice versa. However, to say that the markets may fall into recession with no proof whatsoever is misleading and innuendo at best. There is no proof that a downturn is imminent. Inflation is tame, the labor market is at levels not seen before nor is there a global recession looming out there or affecting another country that will have an impact on the US. As traders we look for a preponderance of evidence before placing or making a trade. There is no such evidence present at this time and if there were you can rest assured that we would point it out. Our goal is your continued success and we stress retention of your trading capital as paramount importance. Because without trading capital, there's no trade and no business.
Author

Nick Mastrandrea
Market Tea Leaves


