As the Gold/Silver ratio drops, the case for long Gold builds momentum

Gold had been one of the clearest macro trades in the market through 2025 and into early 2026. Prices surged to fresh all-time highs, briefly pushing above $5,000/ounce, as investors leaned into the familiar safe-haven case amid rising geopolitical tension. But the market has since cooled.
As the conflict in the Middle East intensified, with the U.S., Israel, and Iran at the center of it, gold initially moved higher. That rally, however, was short-lived. As safe-haven demand shifted more decisively into the U.S. dollar, gold reversed sharply and fell back below $5,000. More recently, it has been trading closer to $4,700.
Importantly, Gold has not been moving in isolation. In recent weeks, it has traded in close connection with the same cross-asset forces driving equities and the dollar, a pattern that often emerges when market stress picks up and correlations tighten. When headlines suggest de-escalation in the Middle East, equities have generally pushed higher, the dollar has eased, and gold has stabilized or rallied. However, when the conflict appears to be worsening, the dollar has strengthened and gold has tended to pull back.
That leaves gold in an interesting spot. The bigger uptrend still appears intact, but the trade has become much more reactive, with headline flow now driving a larger share of the day-to-day action. Even so, the recent pullback has arguably improved the long-term setup. Positioning looks less stretched, and the broader forces that helped power gold higher in the first place are still very much in play.
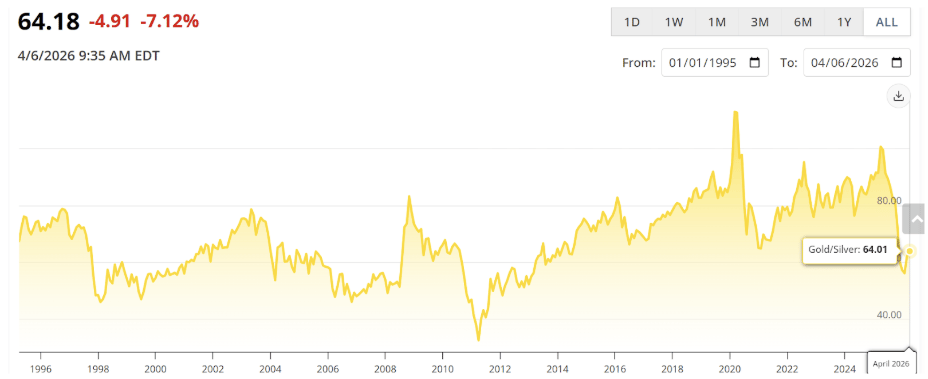
Ratio drops to lower end of historical range
Another piece of the puzzle is the gold/silver ratio, a metric precious metals traders often watch for clues on relative value.
The math is simple. Take the price of gold and divide it by the price of silver, and the result tells you how many ounces of silver it takes to buy one ounce of gold. Right now, that relationship has moved in a notable way.
For much of the last decade, the gold/silver ratio spent a good deal of time above 80, reflecting long stretches in which gold outperformed silver or silver simply failed to keep pace. That is part of what makes the recent move so notable.
Both metals have rallied in recent months, but silver has climbed faster. That has pushed the gold/silver ratio sharply lower, with the reading recently dipping into the mid-50s, a level not seen since around 2013. Even after some stabilization, the ratio remains near the low end of its historical range.
Source: JM Bullion
When the gold/silver ratio reaches an extreme, traders often start thinking in terms of mean reversion. A high ratio can support the case for silver outperforming gold. A low ratio can begin to support the opposite view, with gold looking relatively more attractive.
In practice, that adjustment can happen in a few ways. The ratio can fall from elevated levels if silver begins to rally faster than gold, or if gold declines while silver holds up better. On the other side, when the ratio is low, it can move higher if gold starts to outperform, either by rallying more strongly than silver or by holding its value better during a pullback.
Because the two metals tend to move in the same direction over time, the shift often comes down to which one is leading and which one is lagging. That does not mean the ratio has to snap back toward its historical average right away. But it does suggest that gold’s recent lag versus silver may be getting stretched, and that the relative-value case for gold is getting harder to ignore.
A bullish bias—backed by positioning and forecasts
Layering in a more quantitative perspective, the setup becomes even more interesting.
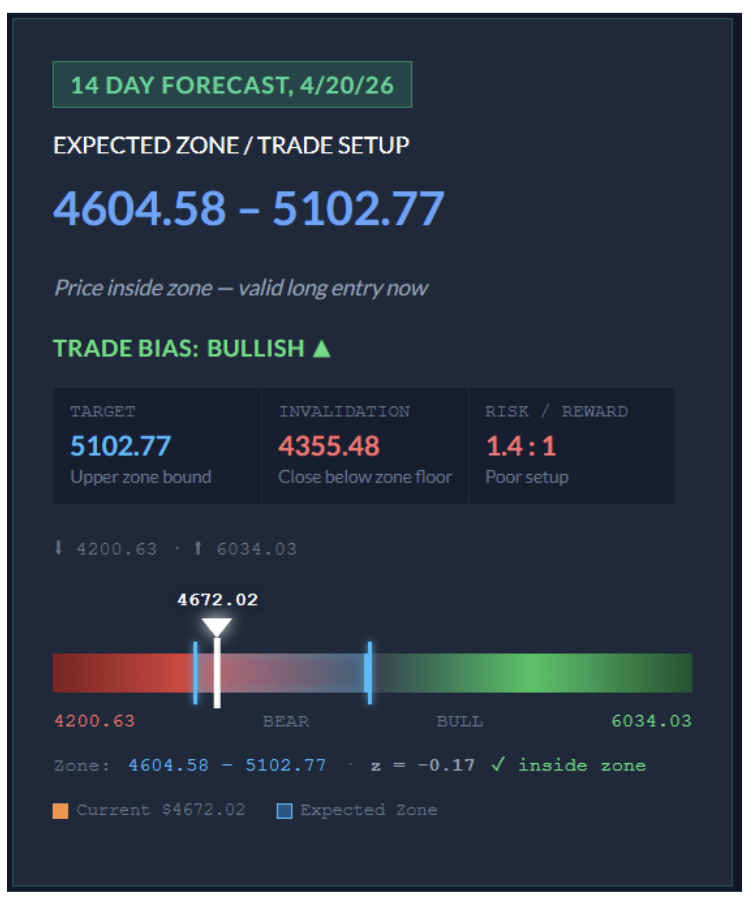
According to Sigmanomics data, gold is currently trading within a defined expected range that supports a medium-term bullish bias. Its 14-day forecast projects an expected zone of roughly $4,605 to $5,103, which places current prices inside a range that still leans constructive despite the recent pullback.
Source: Sigmanomics
That view aligns with what we’re seeing across the broader landscape. Positioning has cooled following the recent reversal. The gold/silver ratio is sitting near historically low levels. And macro drivers—from geopolitical uncertainty to shifting currency dynamics—remain firmly in play.
Taken all together, the setup is becoming harder to ignore. Gold is still being pulled in different directions by safe-haven flows, dollar strength, and broader shifts in risk sentiment. But at current levels, the balance may be starting to shift. For gold bulls, that mix of signals could offer added confidence that the recent dip has created a compelling entry point for another move higher.
Andrew Prochnow
Options and volatility trader with more than 15 years of experience trading global financial markets, including 10 years as a professional options trader. Contributor to tastyfx, Barchart, Benzinga, New Constructs, DailyFX, and Luckbox Magazine. Covers forex, equities, options, and macro markets.
Author

Sigmanomics
Sigmanomics
Sigmanomics is a financial intelligence platform that delivers expert insights, data-driven analysis, and real-time trading signals across global markets.

















