April Fools Doesn’t Kid Markets [Video]
-
US Dollar: March USD is Up at 96.930.
-
Energies: April '19 Crude is Up at 61.75.
-
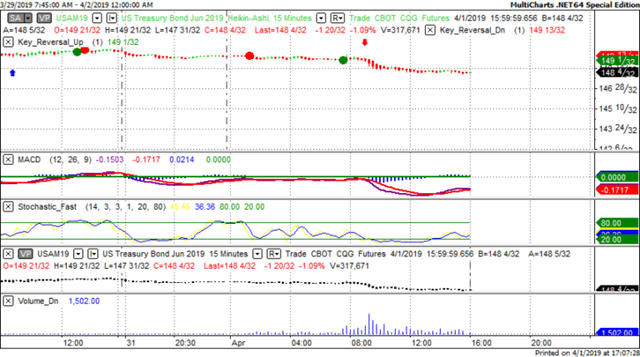
Financials: The Jun 30 year bond is Up 7 ticks and trading at 148.14.
-
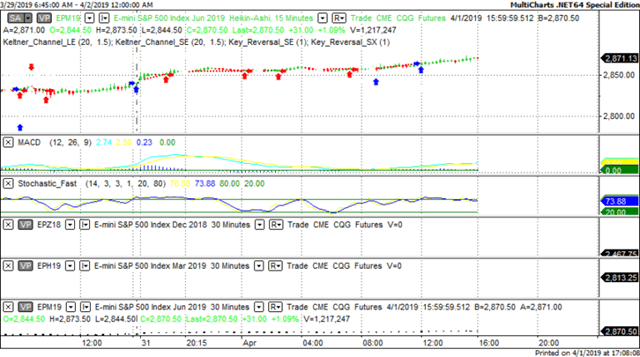
Indices: The June S&P 500 emini ES contract is 10 ticks Lower and trading at 2868.00.
-
Gold: The April Gold contract is trading Down at 1291.10 Gold is 30 ticks Lower than its close.
![April Fools Doesn’t Kid Markets [Video]](https://editorial.fxstreet.com/images/Markets/Currencies/all-kinds-of-money-11794393_XtraLarge.jpg)
Initial Conclusion
This is not a correlated market. The dollar is Up+ and Crude is Up+ which is not normal and the 30 year Bond is trading Higher. The Financials should always correlate with the US dollar such that if the dollar is lower then bonds should follow and vice-versa. The S&P is Lower and Crude is trading Higher which is correlated. Gold is trading Lower which is correlated with the US dollar trading Up. I tend to believe that Gold has an inverse relationship with the US Dollar as when the US Dollar is down, Gold tends to rise in value and vice-versa. Think of it as a seesaw, when one is up the other should be down. I point this out to you to make you aware that when we don't have a correlated market, it means something is wrong. As traders you need to be aware of this and proceed with your eyes wide open.
At this hour all of Asia is trading Higher with the exception of the Nikkei exchange which is fractionally Lower. Currently Europe is trading Higher as well with the exception of the Milan exchange.
Possible Challenges To Traders Today
-
Core Durable Goods is out at 8:30 AM. Major
-
Durable Goods is out at 8:30 AM EST. Major.
-
Total Vehicle Sales - all day. This is major.
Treasuries
We've elected to switch gears a bit and show correlation between the 30 year bond (ZB) and The YM futures contract. The YM contract is the DJIA and the purpose is to show reverse correlation between the two instruments. Remember it's liken to a seesaw, when up goes up the other should go down and vice versa.
Yesterday the ZB made a major move at around 9 AM EST. The ZB hit a High at around that time and the YM hit a Low. If you look at the charts below ZB gave a signal at around 9 AM EST and the YM was moving Higher at the same time. Look at the charts below and you'll see a pattern for both assets. ZB hit a High at around 9 AM and the YM was moving Higher at the same time. These charts represent the newest version of MultiCharts and I've changed the timeframe to a 15 minute chart to display better. This represented a Long opportunity on the 30 year bond, as a trader you could have netted about 20 plus ticks per contract on this trade. Each tick is worth $31.25. Please note: the front month for the ZB contract is now June, 2019
Charts Courtesy of MultiCharts built on an AMP platform Click on an image to enlarge it.
Bias
Yesterday we gave the markets an Upside bias as the USD, Bonds and Gold were all trading Lower and this usually represents an Upside day. The Dow gained 330 points and the other indices gained ground as well. Today we aren't dealing with a correlated market and our bias is to the Downside.
Could this change? Of Course. Remember anything can happen in a volatile market.
Commentary
If we were to judge the markets based on economic news solely; we would have said the markets would drop yesterday, but they didn't. The markets rose because it wanted to and was correlated as such. The proof is in the results. Today we have Durable Goods, Core Durable Goods and Total Vehicle sales. All major, all proven market movers. Time will tell if this upswing continues.
Author

Nick Mastrandrea
Market Tea Leaves


