Another Yen Surprise Looming?

The Japanese yen shocked the financial world during early January 2019. Even financial professionals struggled to explain what happened as the yen appreciated sharply against other major currencies. As unusual as the yen’s market move is that financial media had difficulties to come up with any plausible reason in hindsight.
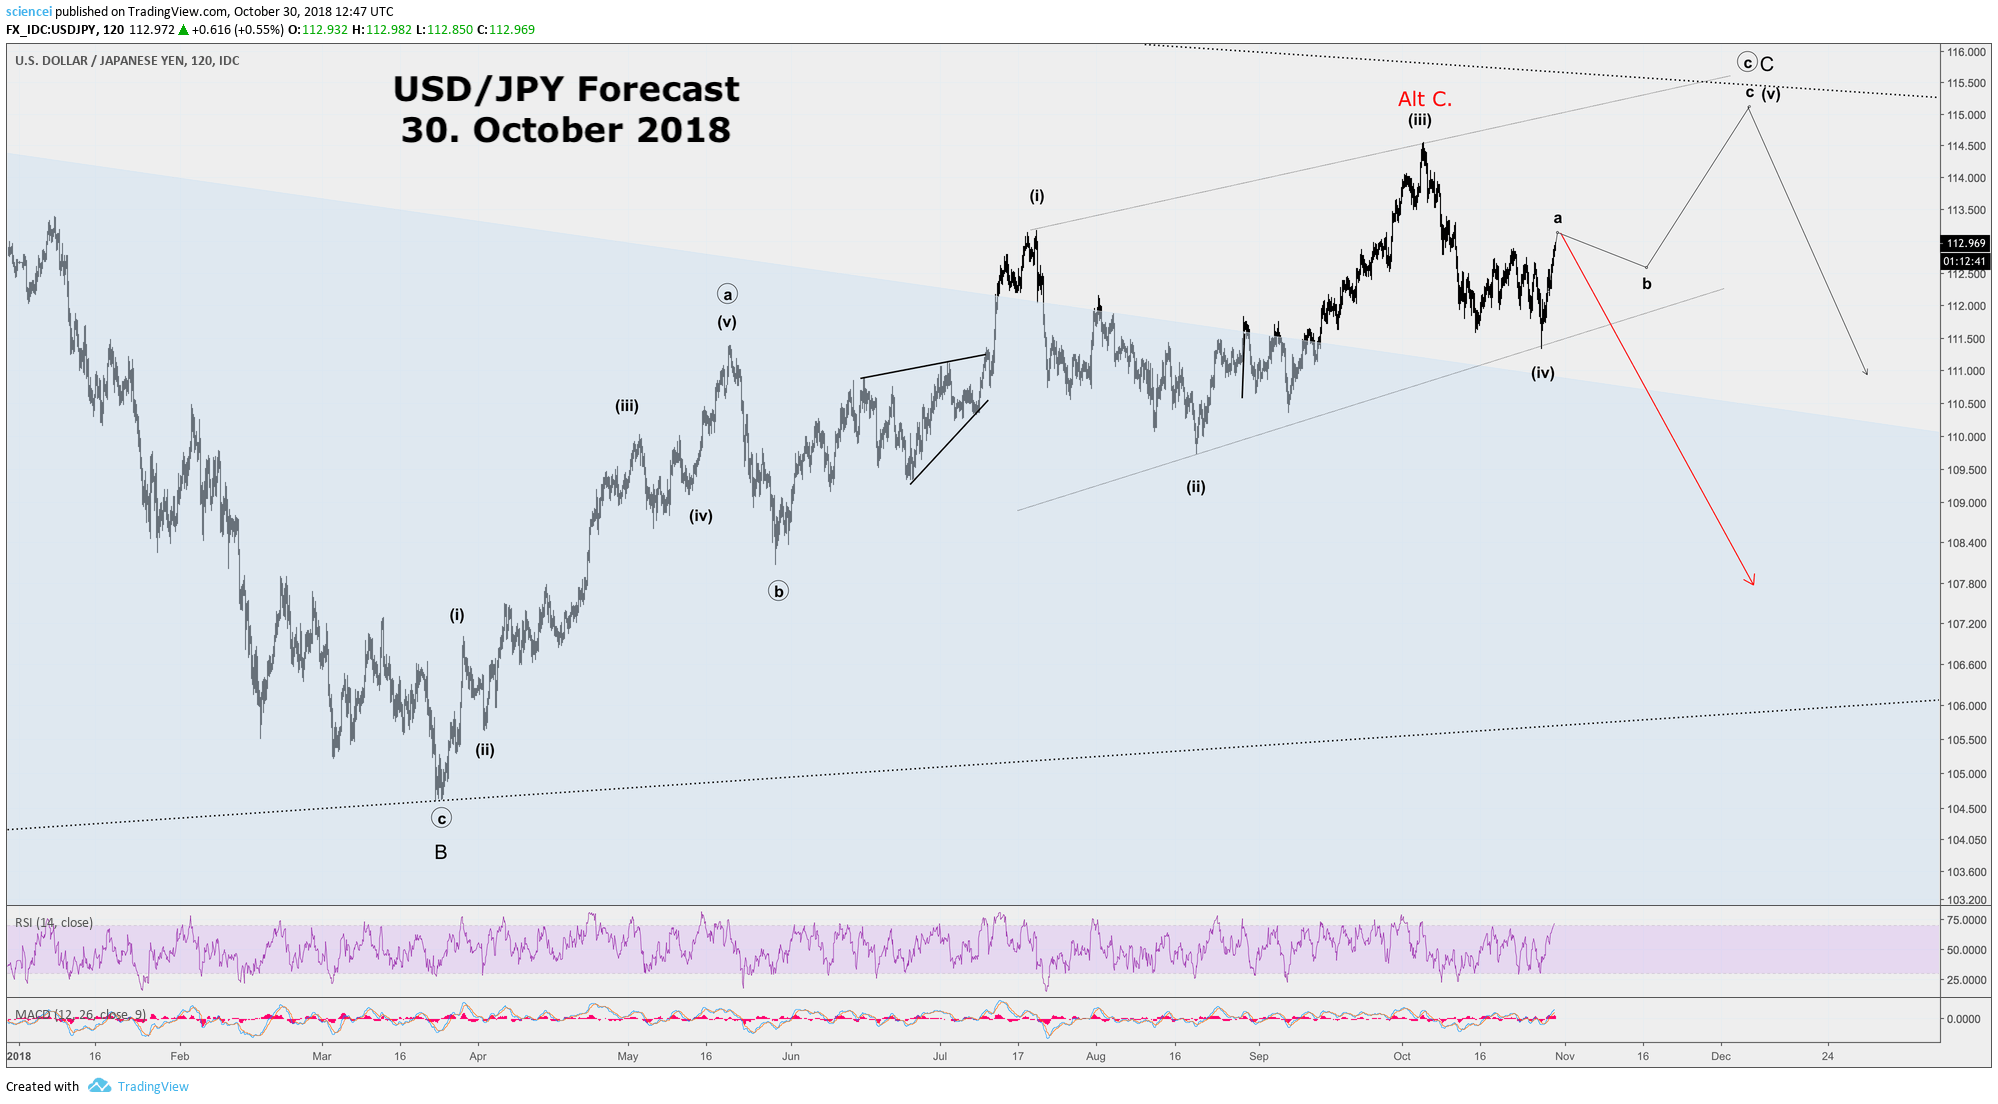
We were not surprised in by the price action in the yen. The very first chart below was shared in late October 2018. It shows that we anticipated a larger degree resolution to the downside. Subsequently, the JPY/USD walked along a fine line between the red and black scenario. Initially, the likelihood for the black pattern to play out slightly outweighed the red scenario. However, at some point odds tipped over towards the red scenario.
We published an exclusive off-schedule update for our clients on December 21st, 2018. The exact wording back then was: “Bulls failed to reach a new high. Instead, the USD/JPY resolved to the downside. All targets, which we mentioned in the last update got crossed to the downside. Another recovery high remains possible but is unlikely. A cyclical reversal occurred probably around the 114.55 high. The USD/JPY currency pair is likely to find its path below 100 during the next few months. It may be worthwhile to have a closer look at typical carry trade currency pairs at this point. The JPY is near mid-term trends versus a few of the higher yielding currencies. The respective trend breaks could signal attractive risk/reward opportunities for being long JPY.”
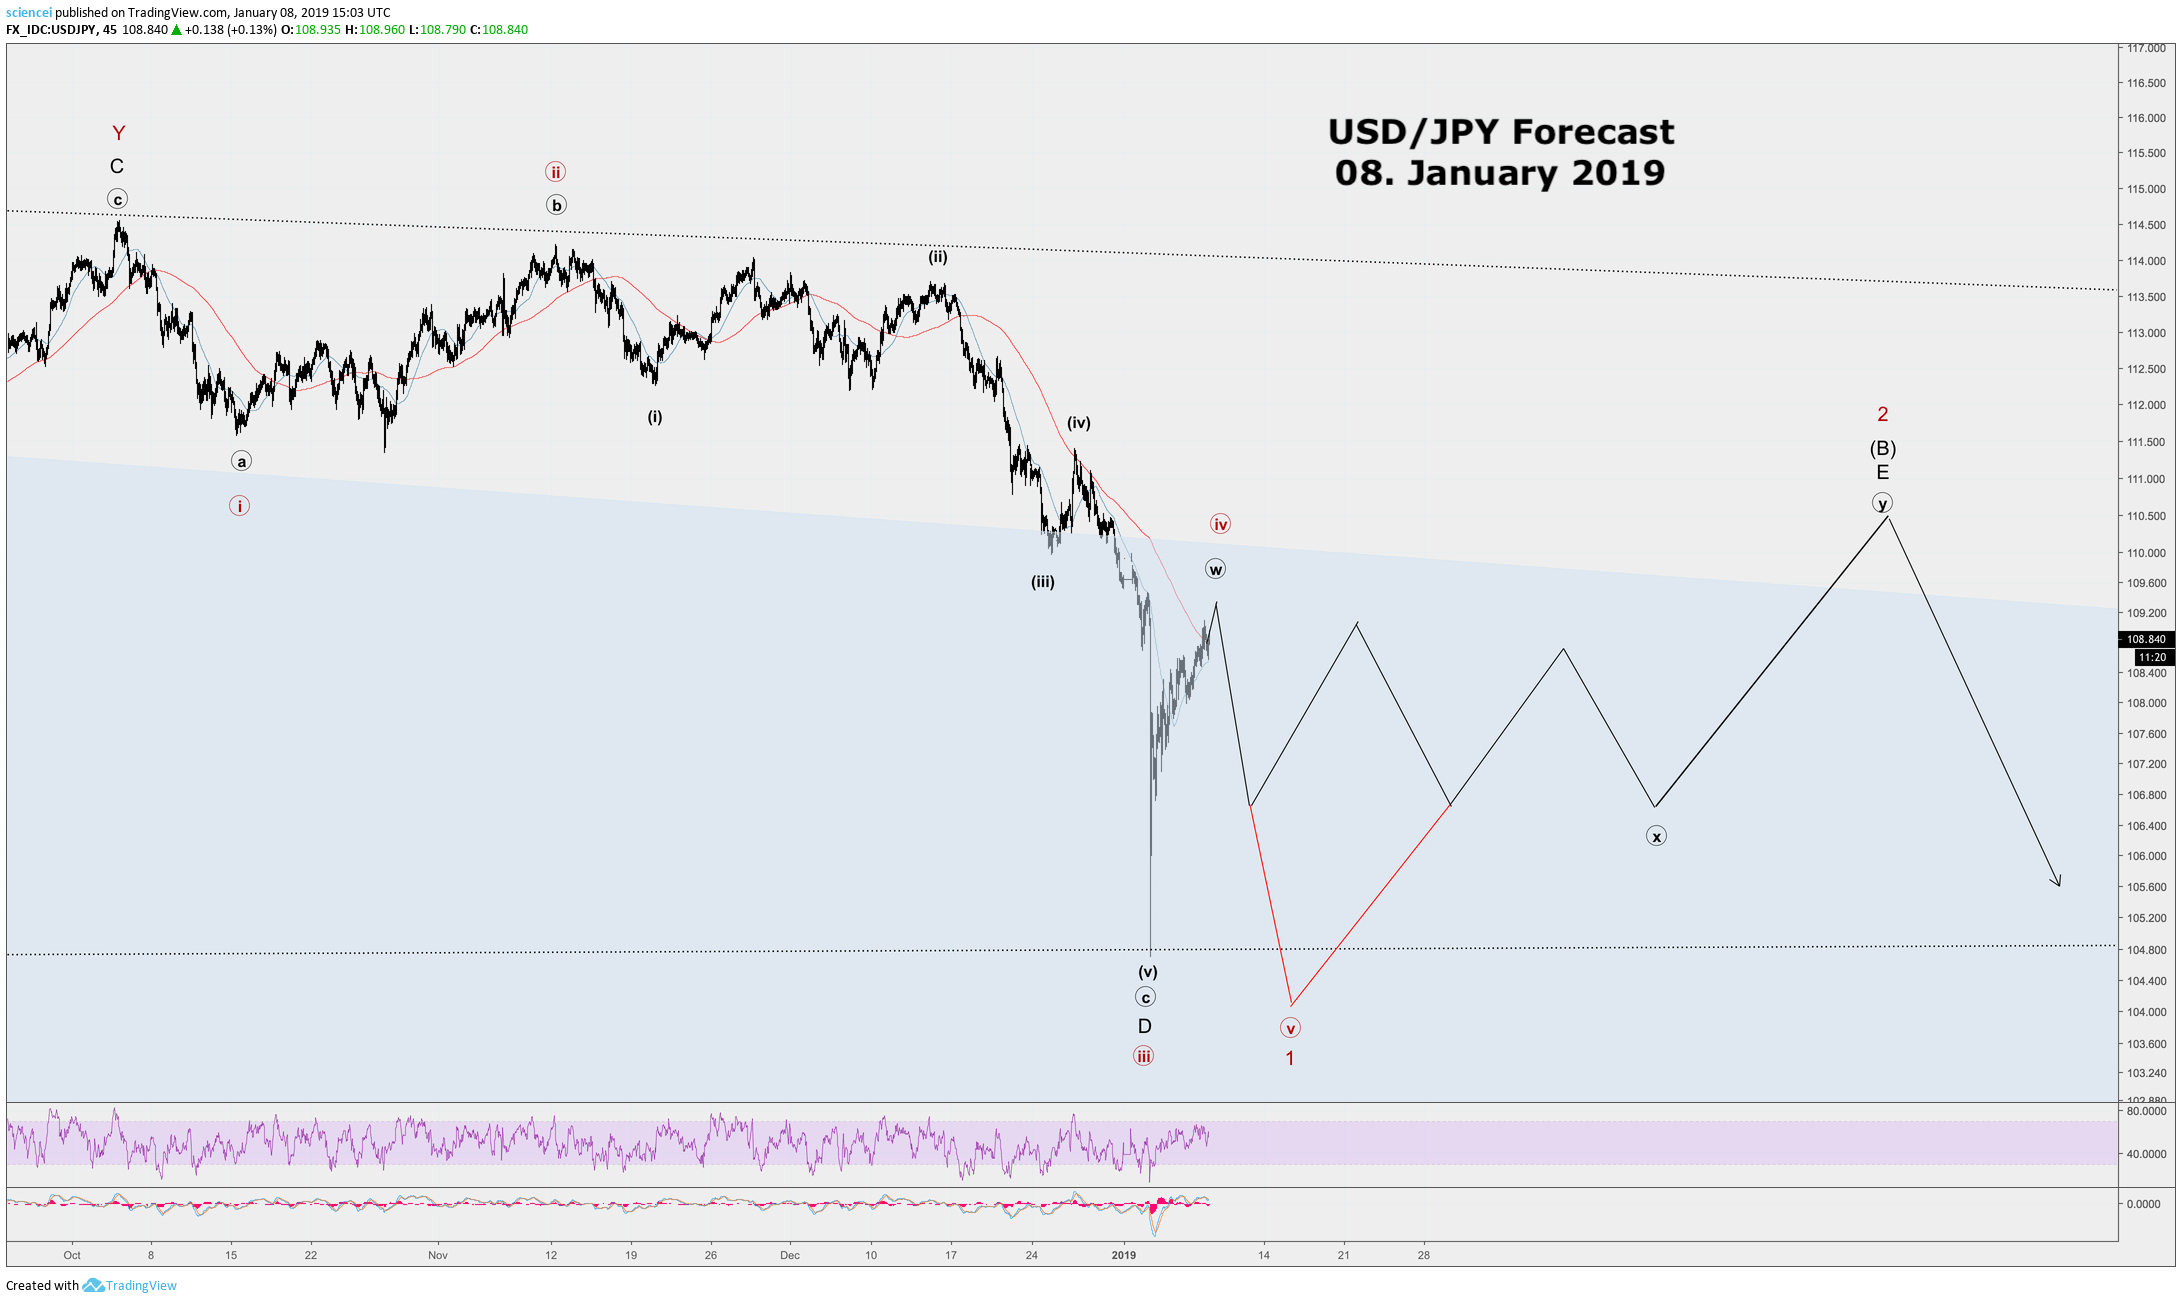
The call could not have been timed more precisely. Instead of taking months, the yen produced a flash crash during early January as most are aware of today. The next chart below was sent to our clients after the crash. It shows our expectations for a deep retracement instead of a waterfall decline below 100. The outlook got confirmed as well as we publish this write up.
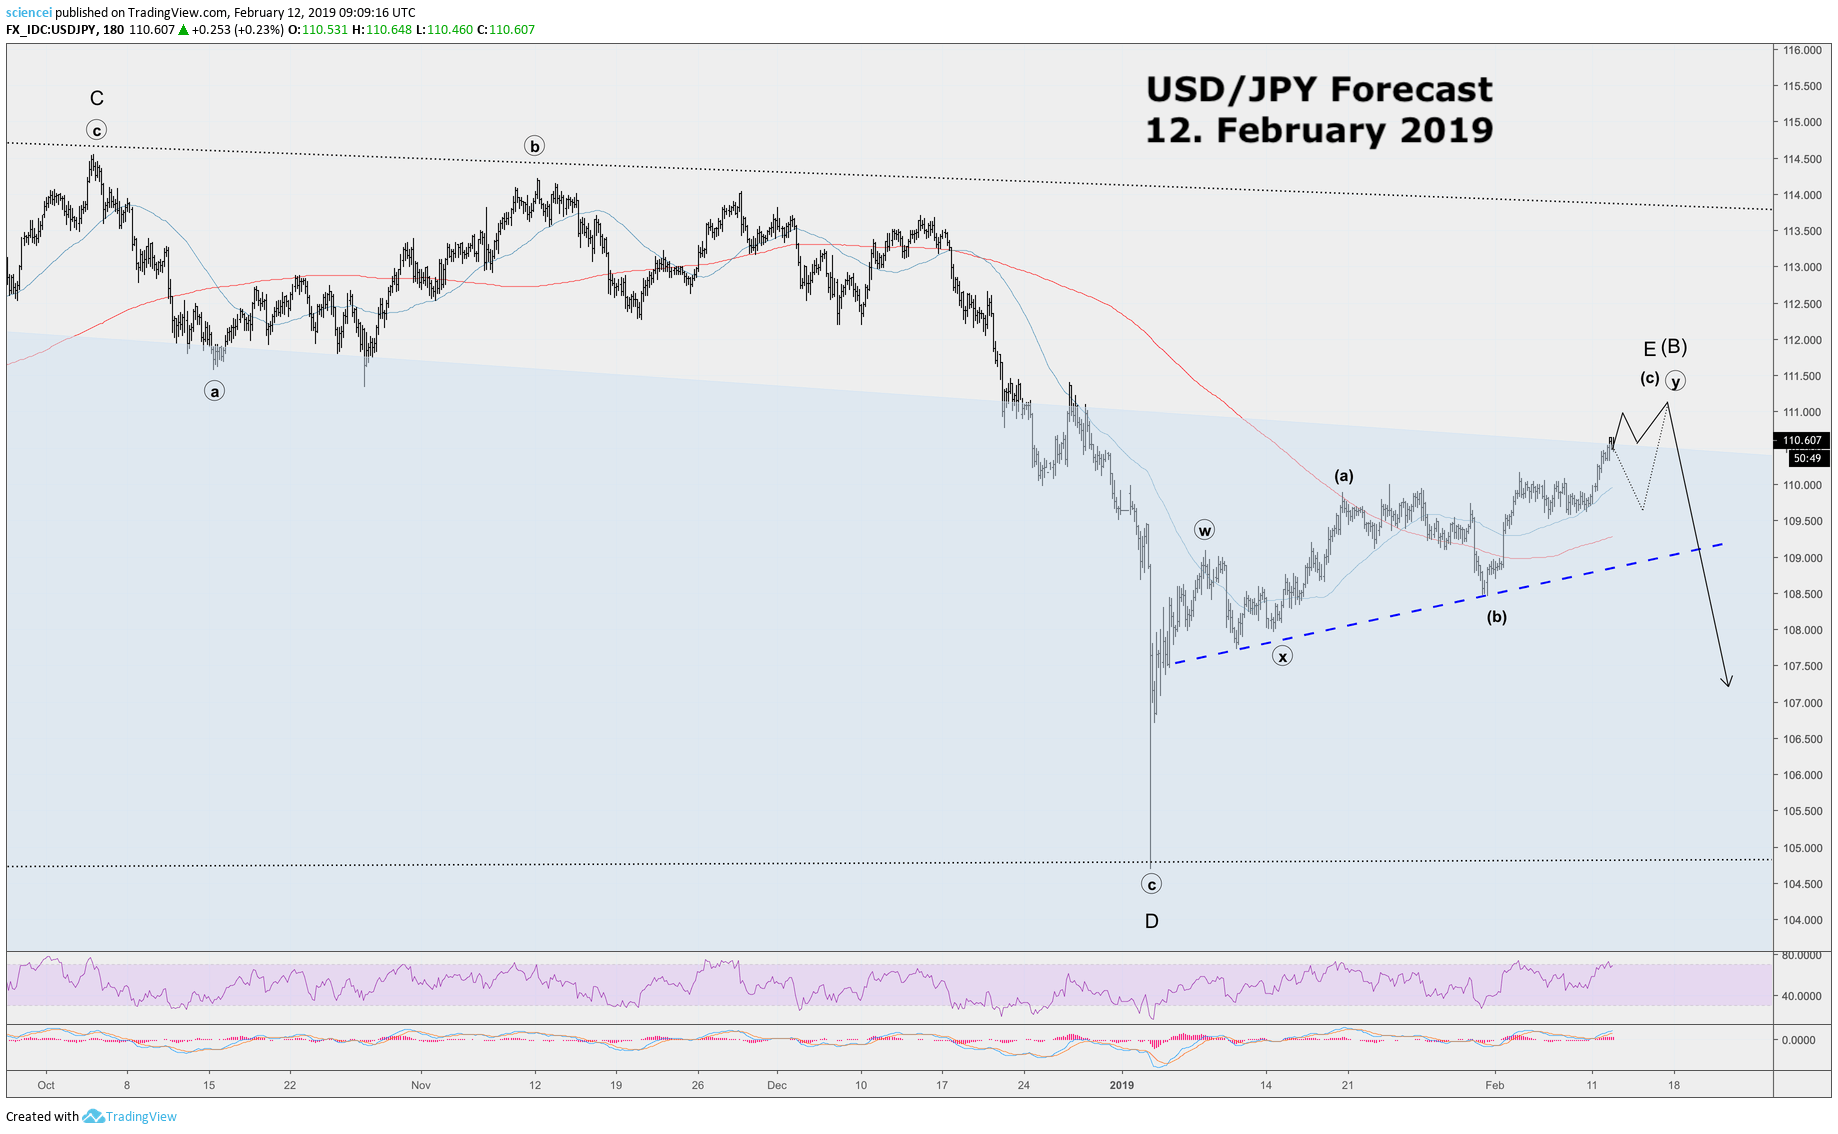
What is likely to happen with the USD/JPY going forward? The E-wave of minor degree is probably at a mature stage. Another down-up sequence transforms the entire advance from the early January 2019 low into a corrective pattern. Any zig-zag variation of minuette or subminuette degree potentially finishes a paramount triangle pattern of intermediate degree. The triangle unfolded since mid-2016. The solid black scenario shows an impulsive wave (c). Alternatively, the dotted black line shows an ending diagonal. Either one of these two scenarios is most likely to play out at the current stage. Both scenarios are most likely in serious trouble if the blue dotted support gets violated on the downside. That action most likely perpetuates the current wave structure as a corrective 3-wave zig-zag pattern. It remains the earliest gauge whether the final E-wave of minor degree finished. A complete E-wave signals swift action to the downside.
Interested in more of our ideas? Check out Scienceinvesting for more details!
Interested in more of our ideas? Check out Scienceinvesting for more details!
Author

Science Investing Team
Science Investing


