Another run of strong data, supportive for BOC

USDCAD, H1 and Daily
Canada’s trade deficit narrowed to -C$0.6 bln in June from a revised -C$2.7 bln shortfall (was -C$2.8 bln) in May. The narrowing in the deficit was much more pronounced than expected (median -C$2.3 bln) and left the smallest shortfall since the -C$0.5 bln in January of 2017. Export values surged 4.1% in June amid broadbased gains, although a 7.1% gain in energy product values and a 18.9% run-up in aircraft and other transportation equipment exports led the way. Exports values excluding energy products climbed 3.4%. Also notable were a 22.9% increase in exports of metal ores and non-metallic minerals, a 3.7% rise in motor vehicle and parts and a 6.1% climb in industrial machinery. Import values slipped 0.2%, driven lower by a 15.1% drop in energy products amid a 27.4% plunge in imports of refined petroleum energy products. Several Canadian refineries that were shut in April and May resumed operation in June, cutting demand for imported motor vehicle fuel. Imports of aircraft and parts fell 17.1% in June after a sizable gain in May.
This is a strong report that supports an upward boost to the Q2 GDP forecast to the 3% area. Hence this should keep the BoC on course for another tightening, though the sharp drop in oil prices this week, as increased output from OPEC and Russia starts to kick in, presents a bearish driver to the Canadian Dollar.
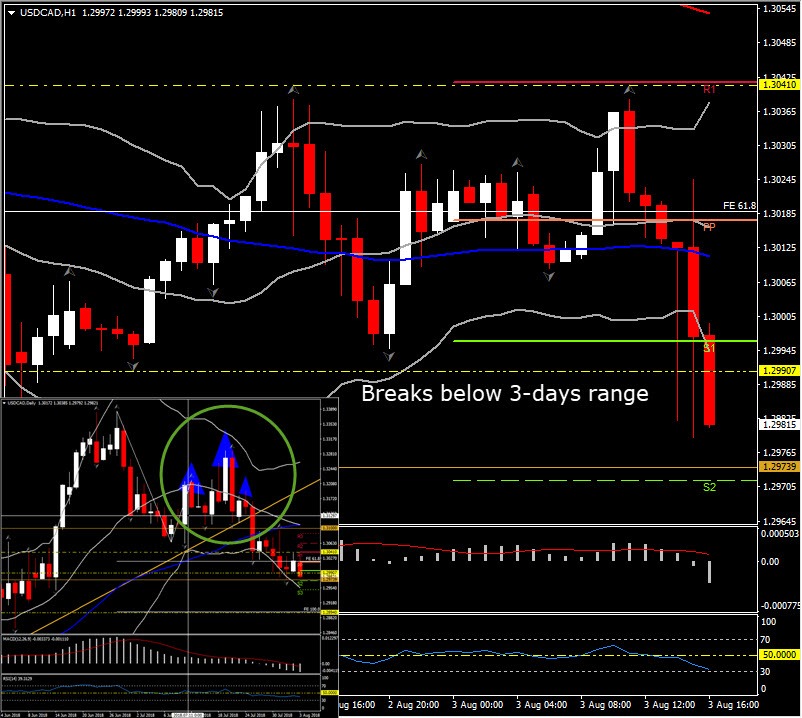
USDCAD slipped from near 1.3020 to 1.2979 lows after the data, which revealed a softer US jobs report, and a narrower than expected Canada trade deficit. Immediate Support now comes at Wednesday’s 7-week bottom and S3, at 1.2974 and 1.2950 respectively.
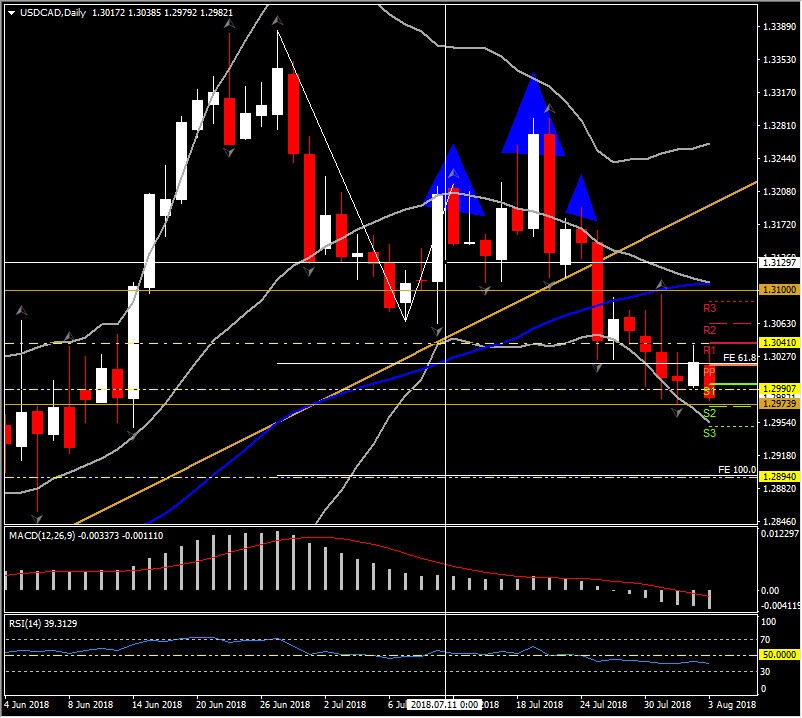
As reported in July 25: ” .…Therefore a breakout below Support area along with the fact that the pair moves within the lower Bollinger Band area for the 4th day in a row, would suggest the retest of the next Support area at 1.2985-1.3015. The latest Support area is set between 61.8% Fib. level and the 61.8 Fibonacci extension from the rebound seen on July 9. Further losses would open the doors towards 1.2900, and the confluence of 200-day SMA and the FE 127.2, at 1.2820. Another sign for the bearish outlook of the USDCAD could be the confirmation of the head and shoulders formation in the medium term chart. “
Therefore, after the confirmation of head and shoulder bearish formation, the pair consolidated this within 1.3040-1.2980 area and it is currently trading below this range, suggesting that the doors towards 1.2900 area might have already opened.
From the technical perceptive, intraday and daily momentum indicators are extending to the downside.
In the 4-hour charts, RSI failed to break neutral zone and it is currently moves towards the oversold barrier. In the daily chart, RSI continues to drift lower since July 24, while MACD oscillator rises within the negative area as its signal line crossed today below zero line, indicating the potential rises of negative momentum.
Author

Having completed her five-year-long studies in the UK, Andria Pichidi has been awarded a BSc in Mathematics and Physics from the University of Bath and a MSc degree in Mathematics, while she holds a postgraduate diploma (PGdip) in


