Another Look at the US Yield Curve

In early September, we discussed how the yield curve briefly turned negative. The yield curve we referenced was the difference between the US 10-year yield and the US 2-year yield. Why was this such a big deal? Because on the last 7 occasions, it led to a recession (however the recessions were 6-9 months later). At the time, we compared the price action of the inverted yield curve to the price action in WTI Crude oil from Q4 of 2019. We considered the possibility that after selling off and bottoming, the yield curve may form an Inverted Head and Shoulders pattern and a move back to the 61.8% Fibonacci retracement level of the entire move lower, just as WTI Crude oil had done in Q4 of 2019.
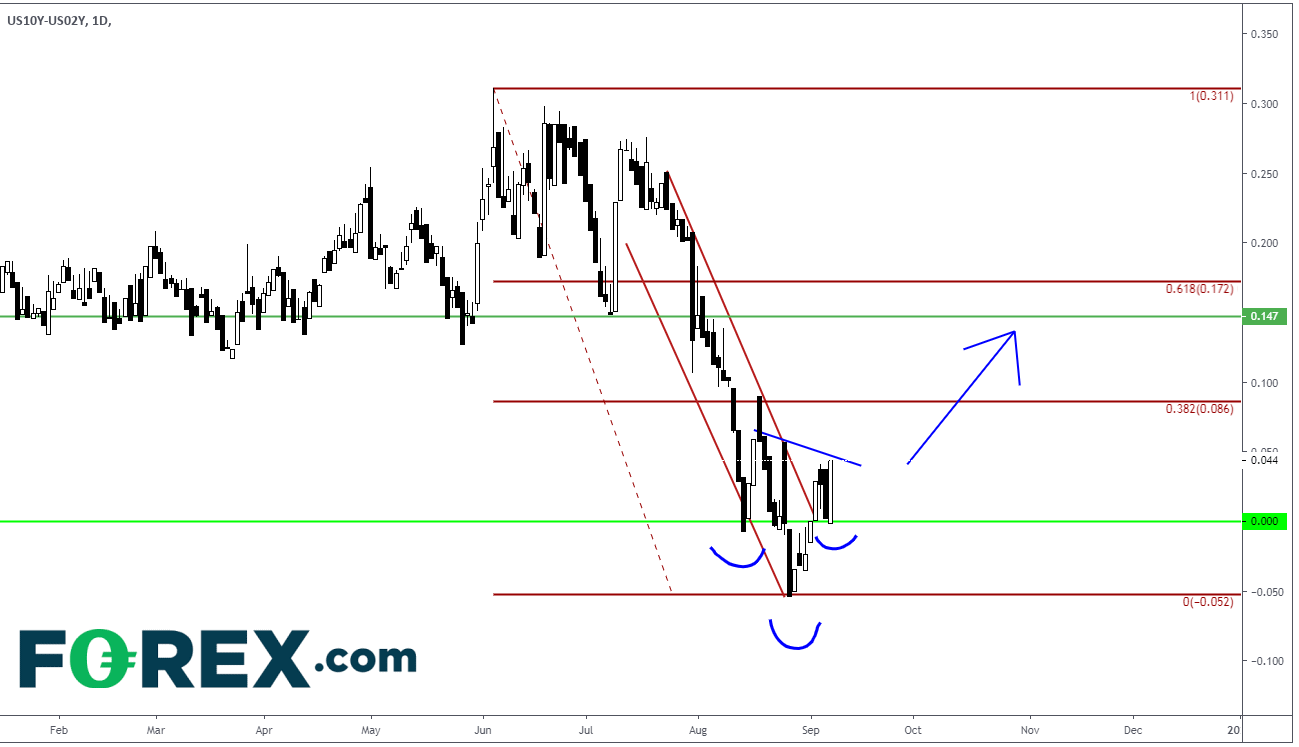
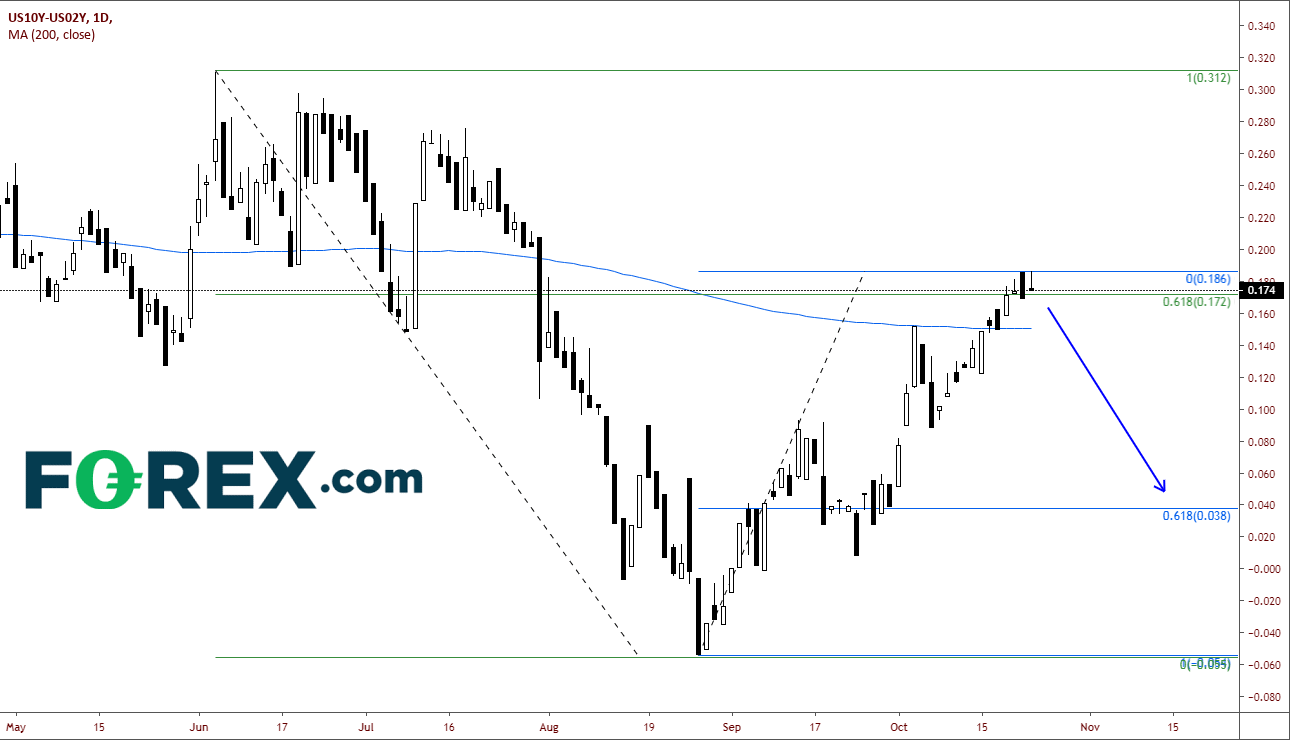
Source: Tradingview, FOREX.com
A month and a half later, the US yield curve has reached the 61.8% Fibonacci retracement level, met the target level for the inverted head and shoulders pattern, and put in a bearish engulfing pattern yesterday on the daily chart.
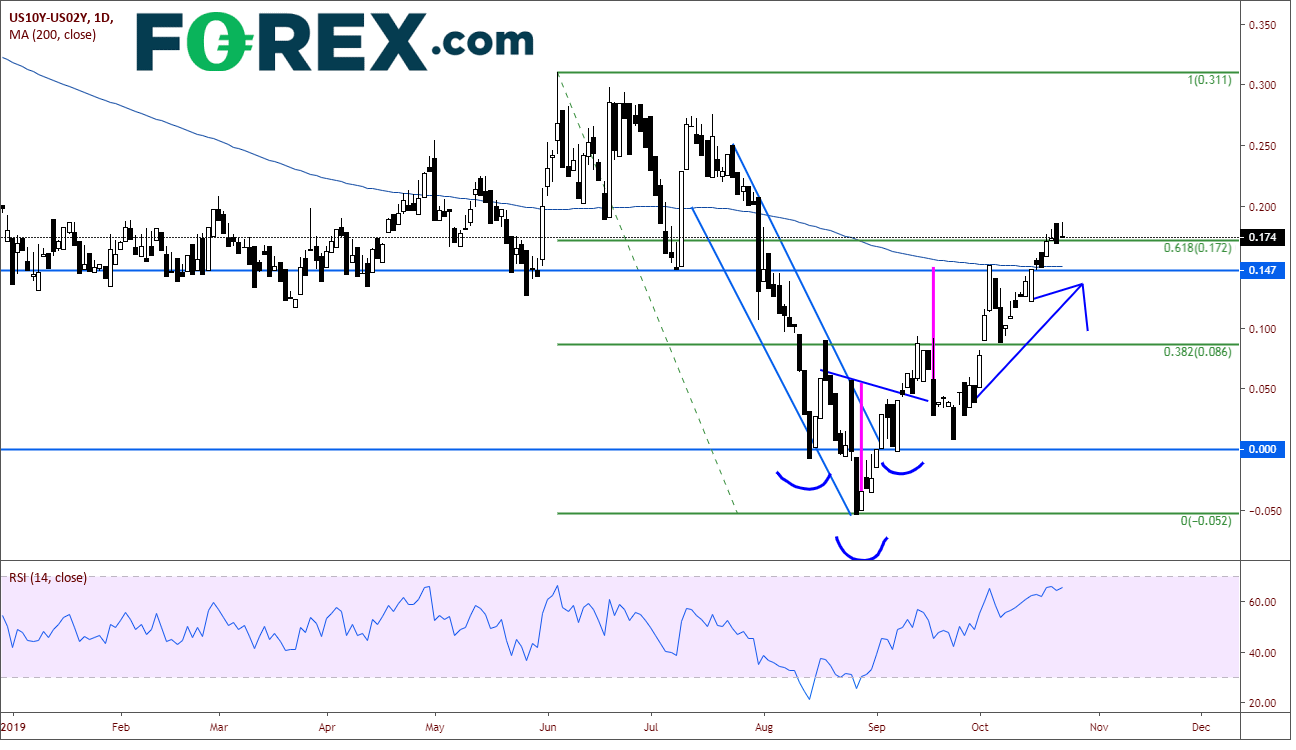
Source: Tradingview, FOREX.com
Where does the yield curve go from here? Let’s first look at the daily WTI crude chart, which had a false price breakout above the 61.8% Fibonaccci retracement level and pulled back, forming a wide consolidation channel between 50.50 and 63.80. Today, 6 months after the start of the channel, WTI Crude oil is still trading within that channel, mean reverting around the 200 Day Moving Average. However, price did test the lows 4 times.
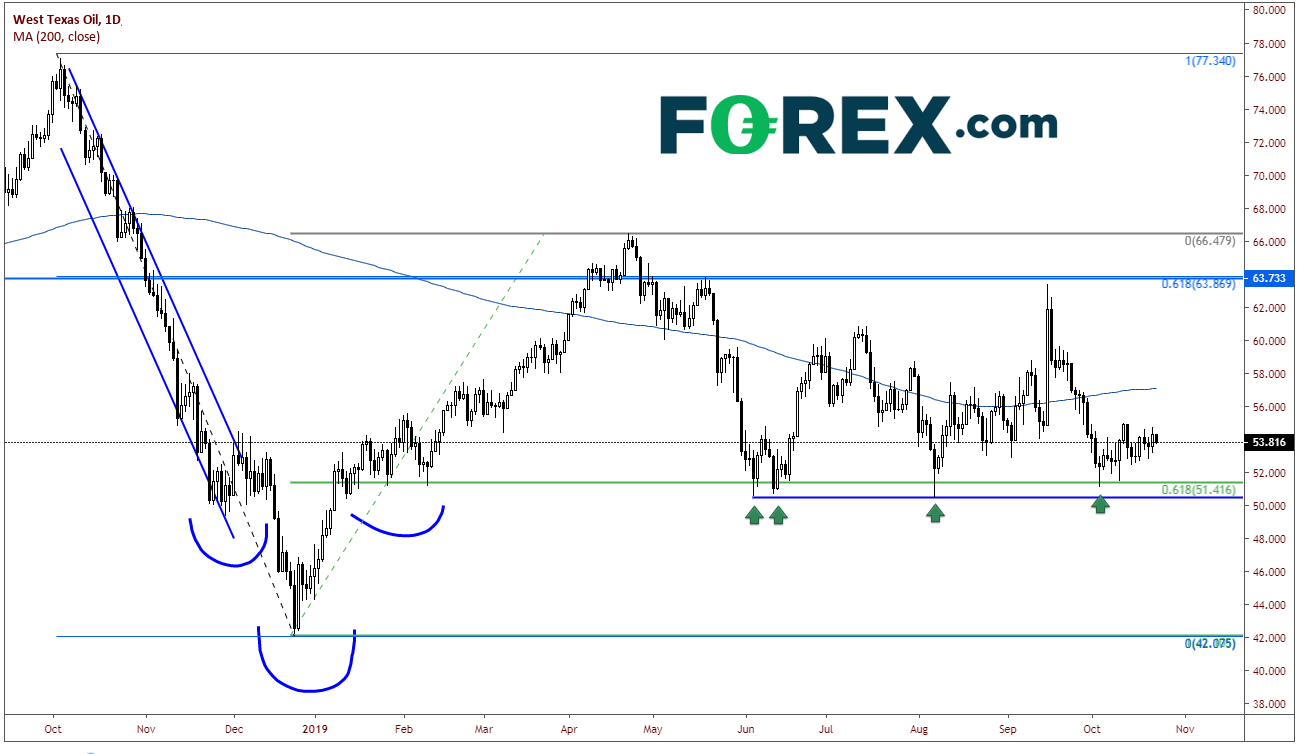
Source: Tradingview, FOREX.com
If we focus on the price action in WTI Crude Oil as it pulled back after reaching the highs on April 23rd at 66.48, we see that price pulled back to the 61.8% Fibonacci retracement level from the lows on December 24th to the highs on April 23rd and put in a double bottom. This low defined the bottom of the channel, within which price currently trades.
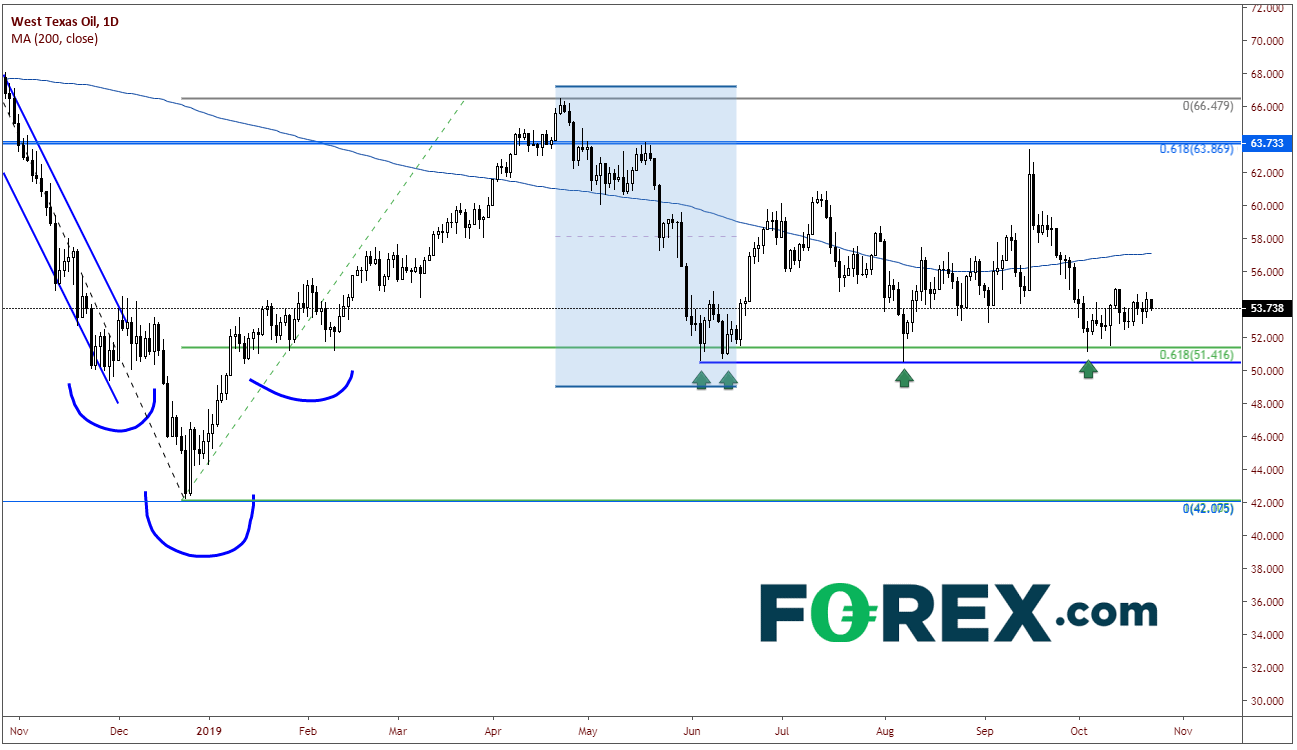
Source: Tradingview, FOREX.com
Now, if we theorize that the US Yield Curve will act in the same manner as WTI Crude oil, we can look for the US yield curve to pull back to the 61.8% Fibonacci retracement level from the August 27th lows to yesterday’s highs, which is 0.038.
Source: Tradingview, FOREX.com
If the US yield curve does pull back to that level, what happens next? Will it head into negative territory again?
Let’s take one step at a time….but keep an eye on WTI Crude Oil for clues!
Author

Forex.com Team
Forex.com


