Another Look at the Dow
In spite of dramatic and controversial political storms, the US equity markets have been racing on upwards recently. Is this truly a powerful new trend, or are we at the edge of a precipice? Both the Dow and the SPX500 show similar patterns, but the focus here is on the Dow.
Figure 1: Dow Monthly Chart
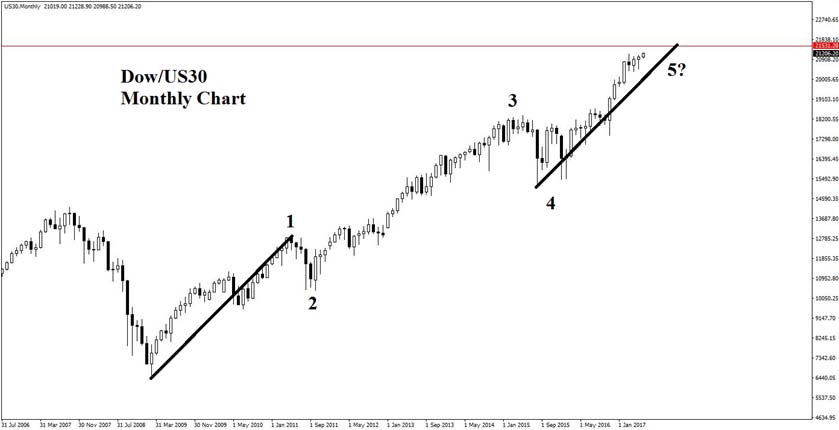
The monthly chart is suggestive, as any Elliott wave practitioner will notice the familiar five-wave structure that may precede a longer term decline. Although there are no signs of wave 5 (as marked) stopping yet, there is a potential resistance level at the 21531.28 mark. It suggests that there may be at least a significant pause, should price momentum show signs of slowing.
Figure 2: Weekly Chart for the Dow shows divergence
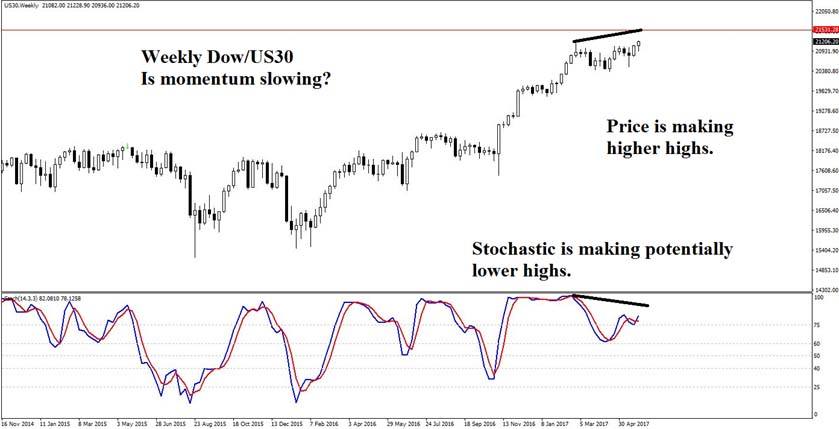
The weekly chart in Figure 2 is even more suggestive, as it is showing signs of divergence with the (14,3,3) stochastic. Whilst this in itself is hardly sufficient reason to panic, this pattern is typically accompanied by various potential short term reversal patterns, such as a Wyckoff upthrust pattern, or a fake breakout of the small weekly range between February 2017 and the current time. It would be wise to be watching for signs that this breakout is failing. If it breaks through the resistance level marked, then the logical conclusion will be that the trend is intact for now.
Figure 3: Daily Blue Box
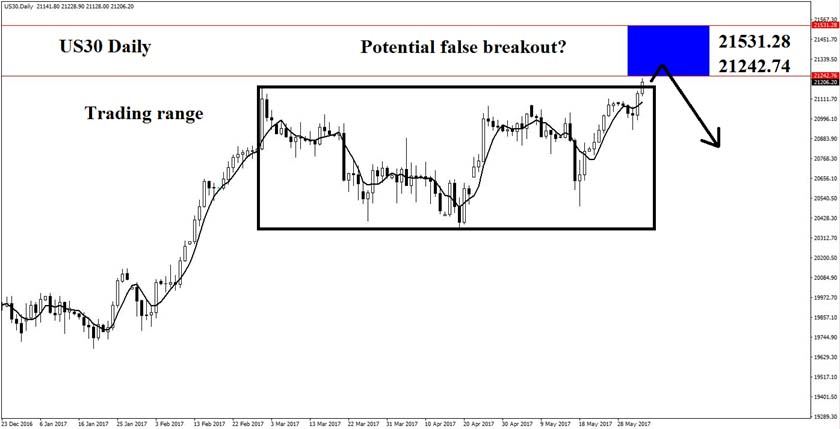
For the brave who wish to try a countertrend trade, the daily potential turning point is the Blue Box demarked by the 21242.74-21531.28 range. The moving average is the 5 SMA, and is used mainly to monitor for potential trend reversal chart patterns. It is worth noting that there is still tremendous momentum to the upside on the higher timeframe charts, and any trade taken against these trends must of necessity be aggressively managed.
Figure 4: A Potential Daily Butterfly Pattern
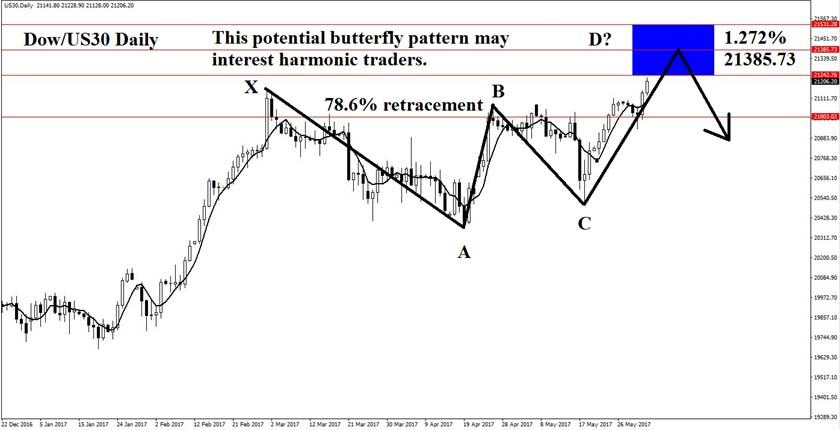
Some harmonic traders may also be drawn to this trade by the potential butterfly pattern that is forming on the daily, with a potential termination point at 21385.73. Ultimately, triggers to the downside will be required for the trade to occur, and the daily chart is the most likely timeframe for this.
Author

Kaye Lee
Straight Talk Trading
Kaye Lee holds an MA in Economics and Law from the University of Cambridge. He is the Head Trader Consultant for Straight Talk Trading and Trades Happening Now.


